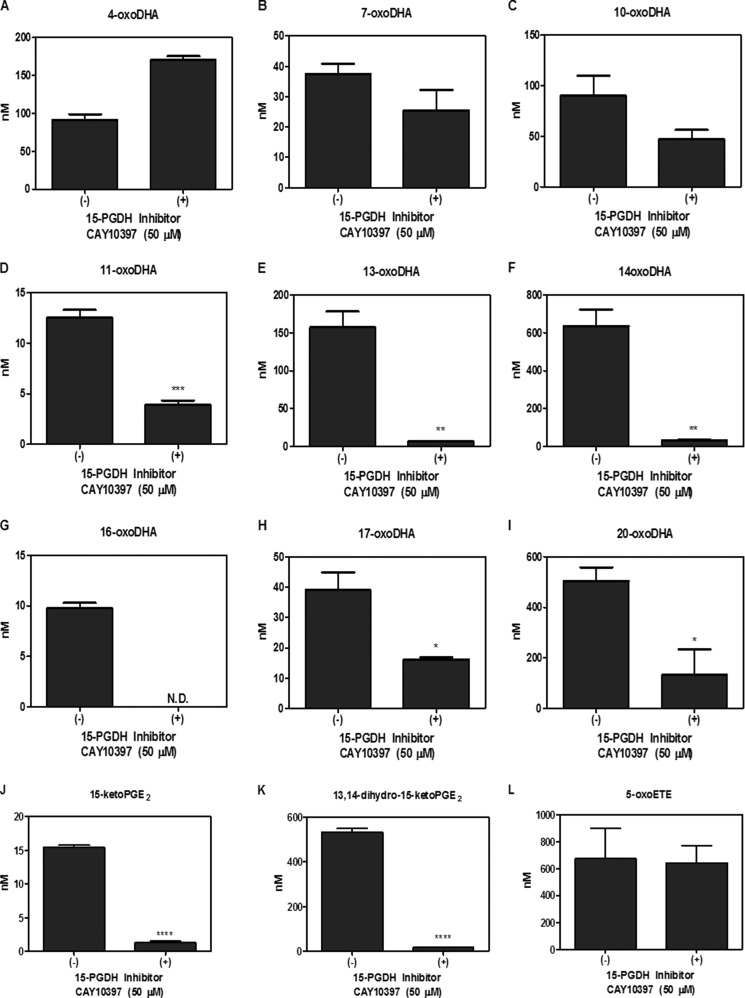
FIGURE 4.
Electrophile formation in A549 cells. A549 cells were treated with 2 μm HDoHE regioisomers (A–I) with and without 50 μm CAY10397 for 4 h, and oxoDHA formation was quantified. Formation of oxoDHA metabolites corresponding to each HDoHE regioisomer was detected for all except 8-HDoHE. 2 μm PGE2 (positive) and 5-HETE (negative) treatments were used as controls for 15PGDH substrate specificity, and 15-ketoPGE2 (J), 13,14-dihydro-15-ketoPGE2 (K), and 5-oxoETE (L) formation were quantified. * p ≤ 0.05, ** p ≤ 0.01, *** p ≤ 0.001, **** p ≤ 0.0001. ND, not detected.

