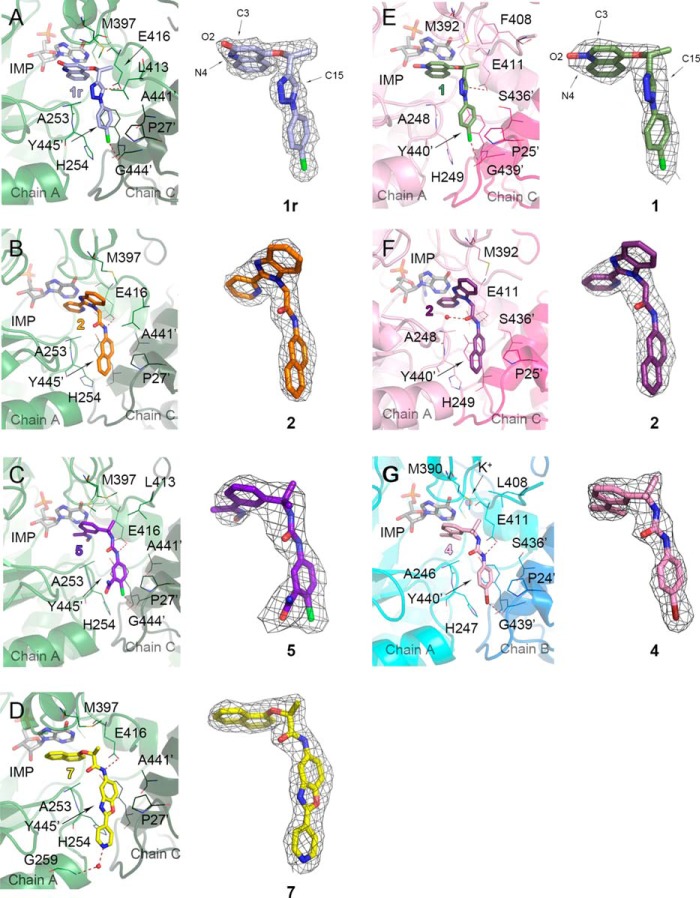
FIGURE 4.
Binding of inhibitors in bacterial IMPDHs. A, BaIMPDHΔL·IMP·1r, where 1r (light blue) indicates a radiation-modified 1. Atoms involved in the N-oxide rearrangement (O2, C3, and N4) and C15 are labeled. B, BaIMPDHΔL·IMP·2 (orange). C, BaIMPDHΔL·IMP·5 (purple-blue). D, BaIMPDHΔL·IMP·7 (yellow). E, ClpIMPDHΔL·IMP·1 (olive), atoms O2, C3, N4, and C15 are labeled. F, ClpIMPDHΔL·IMP·2 (purple). G, CjIMPDHΔS·IMP·4 (pink). Protein chains are in a cartoon representation. Adjacent monomers forming the active site are shown in different colors (green and dark green for BaIMPDHΔL, light pink and dark pink for ClpIMPDHΔL, and teal and marine blue for CjIMPDHΔS) and labeled. Ligand molecules are shown in a stick representation. Hydrogen and halogen bonds are depicted as red dashed lines. A prime denotes a residue from the adjacent monomer. Water molecules in D and F and a potassium ion in G are shown as red and purple spheres, respectively. For each panel, 2mFo − DFc electron density map contoured at the 1 σ level for each inhibitor is shown on the right.

