
FIGURE 6.
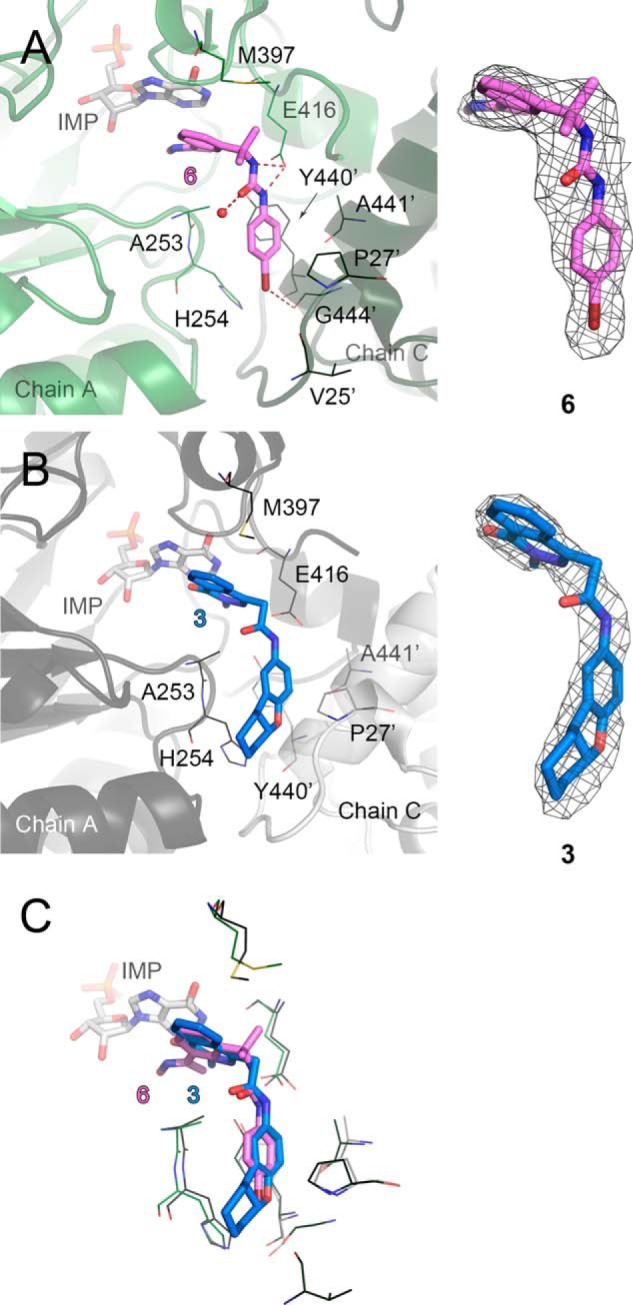
Binding of the most and the least potent inhibitors in BaIMPDHΔL. A, BaIMPDHΔL·IMP·6 complex. Chains A (green) and C (dark green) are shown in a cartoon representation. B, BaIMPDHΔL·IMP·3 complex. Chains A (dark gray) and C (light gray) are shown in a cartoon representation. C, overlay of the two structures. Only the residues participating in binding of the inhibitors are shown. Color code as in A and B. Molecules of IMP (light gray), 6 (violet), and 3 (aquamarine) are shown as sticks. Residues involved in inhibitor binding are represented as lines. A prime denotes a residue from the adjacent monomer. Hydrogen and halogen bonds are depicted as red dashed lines. Water molecule is represented as a red sphere. A and B, 2mFo − DFc electron density map contoured at the 1 σ level for each inhibitor is shown on the right.