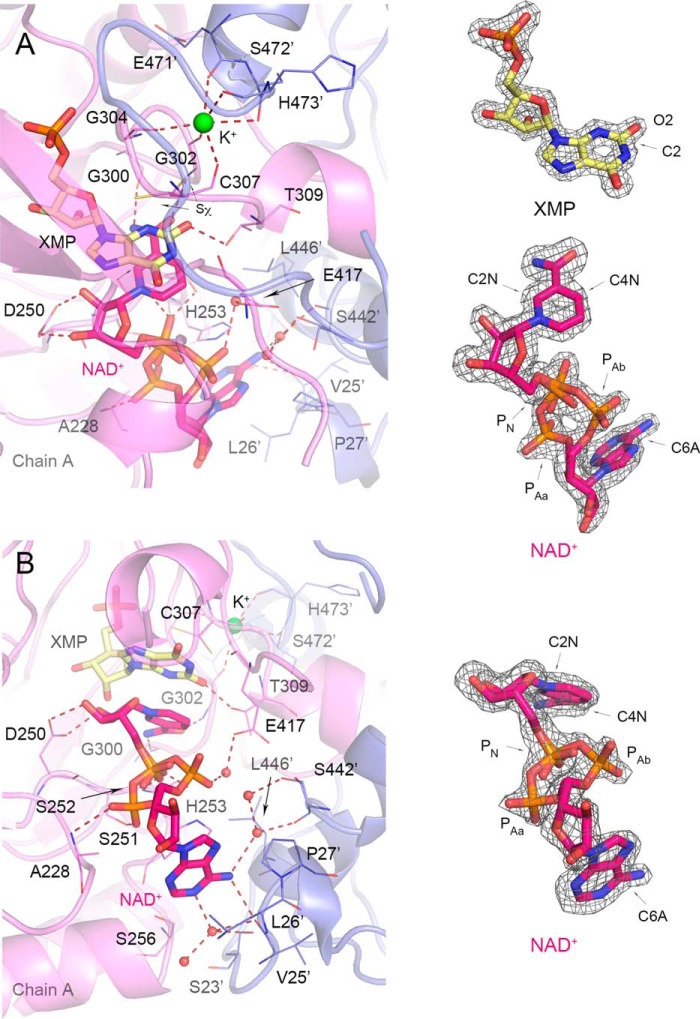
FIGURE 7.
Cofactor binding in VcIMPDHΔL·XMP·NAD+. A, top view of the active site with XMP product and K+ site visible. Chain A (violet) and symmetry-generated adjacent chain (slate blue) are shown in a cartoon representation. Residues are represented as lines. A prime denotes a residue from the adjacent monomer. XMP (light yellow) and NAD+ (magenta) are shown as sticks. Water molecules and K+ ion are shown as red and lime spheres, respectively. Hydrogen bonds and K+ coordinating bonds are depicted as red dashed lines. B, side view of the active site detailing NAD+ binding. Color code and depiction as in A. A, 2mFo − DFc electron density map contoured at the 2 σ level for XMP (yellow) is shown on the right. Also shown on the right for both panels is 2mFo − DFc electron density map contoured at the 1.5 σ level for NAD+ in top (A) and side view (B). Atoms discussed in text are labeled.

