Figure 3.
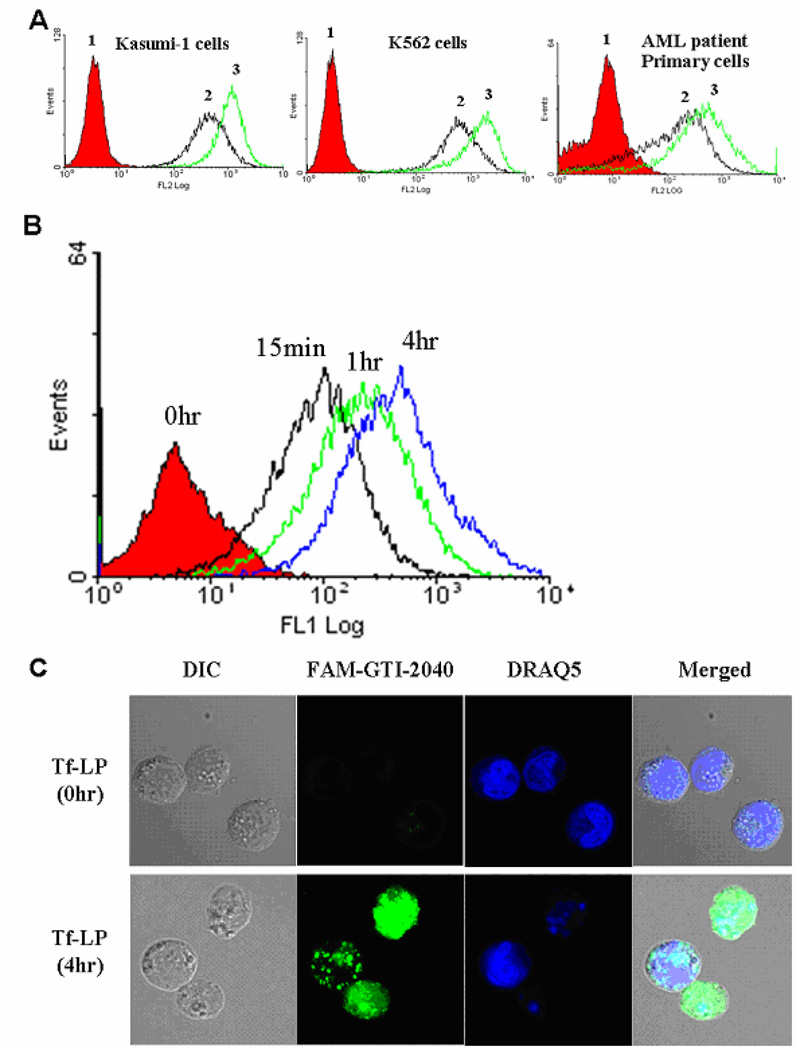
(A) Flow cytometry study of TfR expression. 1. cells stained with PE-isotype; 2. cells stained with PE-anti-TfR; 3. cells stained with PE-anti-TfR after DFO pre-treatment at 30 µM concentration for 18hr. (B) The time-dependent uptake of FAM-GTI-2040-Tf-LPs by AML cells. Kasumi-1 cells were treated with 1 µM FAM-GTI-2040-Tf-LPs at 37°C for various incubation periods, washed twice in PBS and analyzed by flow cytometry. (C) Confocal microscopy images were used to compare the uptake and subcellular distribution of FAM-GTI-2040 delivered by Tf-LPs (1 µM) after 0hr and 4hr incubation respectively. DIC: differential interference contrast (bright field) images. Green fluorescence of FAM-GTI-2040 and blue fluorescence of DRAQ5 were acquired, and merged images were produced.

