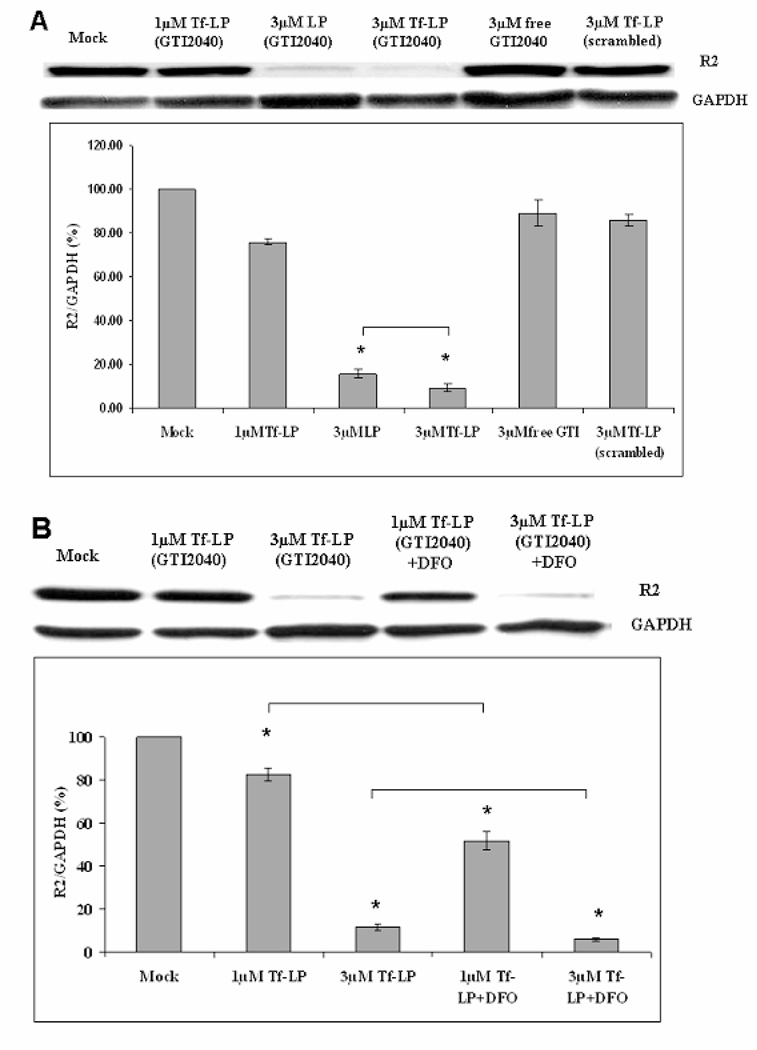
Figure 4.
R2 downregulation in Kasumi-1 AML cells under various conditions after 48hr. Every sample was compared with Mock. Each column reflects the average of at least three independent experiments. The standard deviation is elucidated with an error bar. * indicates these data are statistically different from each other. (A) Upper panel shows the representative western blot image. Lower panel shows the average densitometry data. (B) Improved R2 downregulation with DFO pre-treament at 30 µM for 18hr. Upper panel shows representative western blot image. Lower panel shows the average densitometry data.

