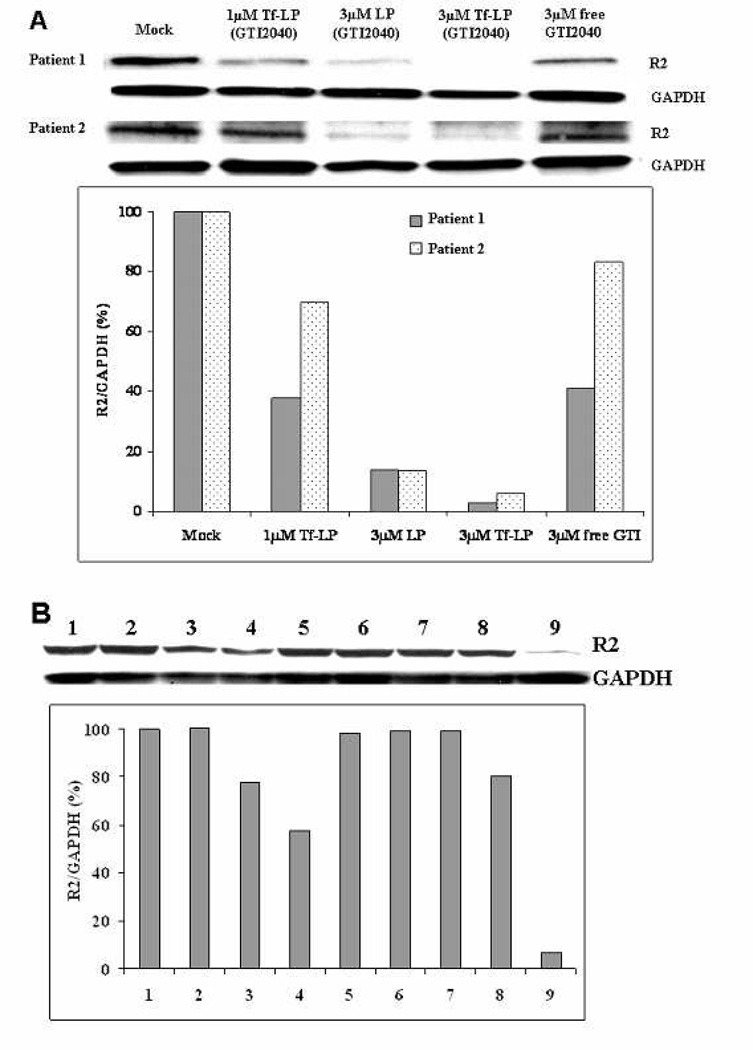
Figure 5.
R2 downregulation in AML patient primary cells after 48hr. Every sample was compared with Mock. (A) Upper panel shows the western blot image. Lower panel shows the densitometry data. (B) Improved R2 downregulation with DFO pre-treated AML patient primary cells from patient 3 after 48hr. (1) Mock, (2) 1 µM Tf-LPs (GTI-2040), (3) 3 µM LPs (GTI-2040), (4) 3 µM Tf-LPs (GTI-2040), (5) 3 µM free GTI-2040, (6) 3 µM Tf-LPs (Scrambled), (7) cells treated with DFO treatment as control, (8) 1 µM Tf-LPs (GTI-2040) + DFO pre-treatment, and (9) 3 µM Tf-LPs (GTI-2040) + DFO pre-treatment. In samples 7, 8 and 9, cells were pre-treated with 30 µM DFO for 18hr before the GTI-2040-Tf-LPs treatment. Upper panel shows the western blot image. Lower panel shows the densitometry data.

