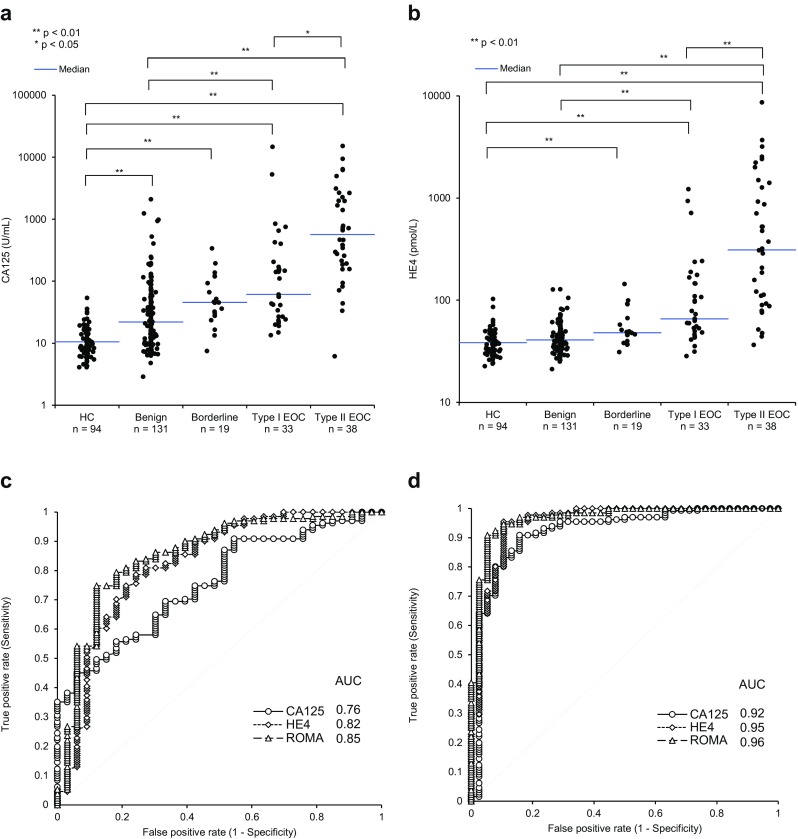
Fig. 1.

Scatterplot analysis of the correlation between CA125 and HE4 with tumor status, and ROC analysis of CA125, HE4, and ROMA between benign and EOC types. Scatterplots of a CA125 and b HE4 levels in healthy controls, benign and borderline tumor, and in type I and type II EOC; ROC analysis and AUC calculation for CA125, HE4, and ROMA in a comparison of c benign and type I EOC and d benign and type II EOC. The p value of the statistical differences between groups was calculated using the Dunn test
