Fig. 2.

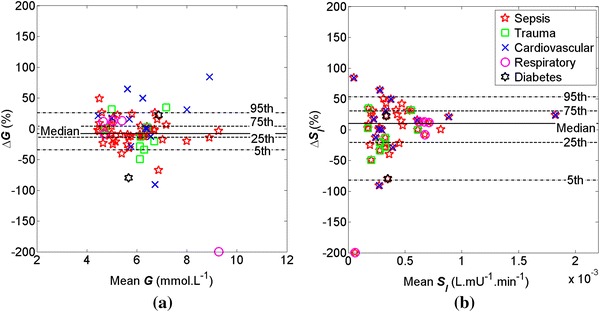
Bland–Altman plots of a ΔG and b ΔS I over the ON/OFF dialysis transition between t = −1 and 2 for severe AKI patients (N = 51). Median ΔG = −8 % and median ΔS I = 10 %

Bland–Altman plots of a ΔG and b ΔS I over the ON/OFF dialysis transition between t = −1 and 2 for severe AKI patients (N = 51). Median ΔG = −8 % and median ΔS I = 10 %