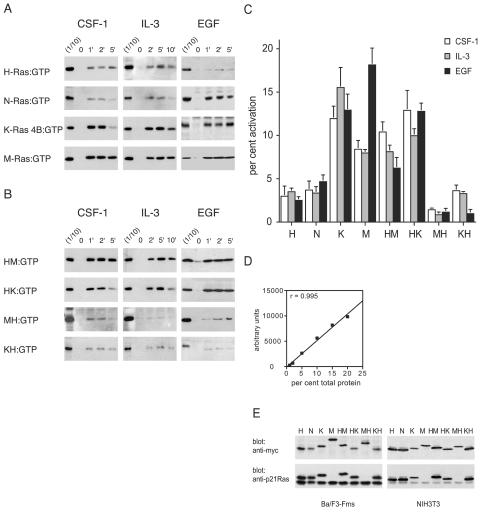
FIG. 1.
Growth factors preferentially activate polybasic Ras proteins. (A) Activation of H-Ras, N-Ras, K-Ras 4B, or M-Ras expressed in Ba/F3-Fms or NIH 3T3 cells was assessed after stimulation of the cells for the indicated times (in minutes) with CSF-1, IL-3, or EGF. GST-Raf-1 RBD was used to precipitate activated, GTP-bound H-Ras, N-Ras, and K-Ras 4B from cell lysates, and GST-Nore1 RBD was used to precipitate GTP-bound activated M-Ras. One-tenth of the amount of the lysate used for precipitation was run in parallel on the same gel (1/10) to allow quantitation by densitometry of the percentage of total Ras that was precipitated. (B) Activation of chimeric Ras proteins expressed in Ba/F3-Fms or NIH 3T3 cells was assessed as described for panel A. All samples of cell lysates were also analyzed for levels of phosphorylated Erk1/2, and equivalency of loading was confirmed by blotting for the exogenous Ras protein (not shown). The results shown are representative of at least three independent experiments for each stimulus and Ras construct. (C) Densitometry was performed in three experiments for each of the constructs and stimuli shown in panels A and B. The value for the first lane (1/10) of each blot was set to 10%, and the relative values of the intensities of bands from pull-down samples were expressed as percentages of the total exogenous Ras. In cases where the precipitation of Ras from the unstimulated sample (at time zero) showed detectable levels of activation, this value was subtracted from those of other samples. The graph shows means and standard errors. P values, calculated using a nonpaired, two-tailed t test, comparing each of the Ras proteins with polybasic tails with each of the palmitoylated Ras proteins were all <0.05. The one exception was the comparison of the HM chimera with N-Ras in the EGF series, where P was 0.3. (D) To validate our assay system (enhanced-chemiluminescence detection and densitometry), lysates from cells expressing tagged Ras proteins were titrated. The percentages of total protein indicate the amounts of cell lysate in relation to that usedin the pull-down assays. After Western blotting, densitometry was performed, and the values were plotted against the amount of protein loaded. The graph shows results, and a linear-regression coefficient (r) of 0.995. The linear-regression coefficient in a second experiment was 0.95. (E) Lysates from Ba/F3-Fms or NIH 3T3 cells were analyzed to allow comparison of the expression levels of exogenous and endogenous Ras proteins using an anti-p21 Ras antibody (which does not detect M-Ras). Also shown are the relative levels of expression of the exogenous proteins used, detected with an anti-myc antibody.

