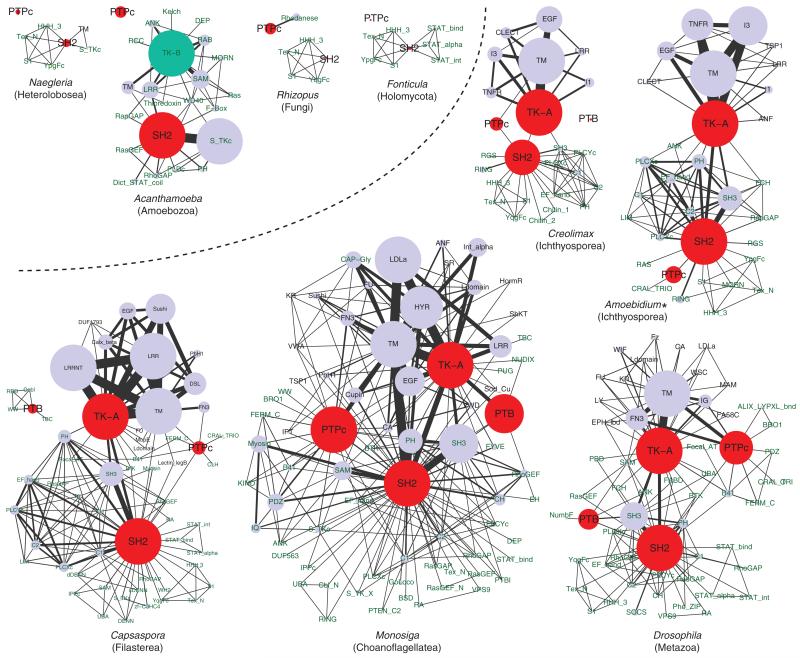
FIG. 3.
Complex architecture of pTyr signaling proteins in holozoans. Domain is represented by a circle, whose size is proportional to the domain count (more than 25 counts are shown in identical size). Each line directly connecting two domains represents their co-occurrence in single proteins, and its width is proportional to the frequency of co-occurrence (more than 25 connections are shown in identical width). Duplicated domains in a protein were not counted. The four core pTyr signaling modules are in red, while the group B TK catalytic domain is in turquoise. SMART or Pfam domain names are shown, except for TK-A (group A TK catalytic domain), TK-B (group B TK catalytic domain), and TM (transmembrane segment). Names of extracellular and intracellular domains are shown in violet and green, respectively. Holozoan and nonholozoan data are divided by a dotted line. Asterisk, RNAseq data.

