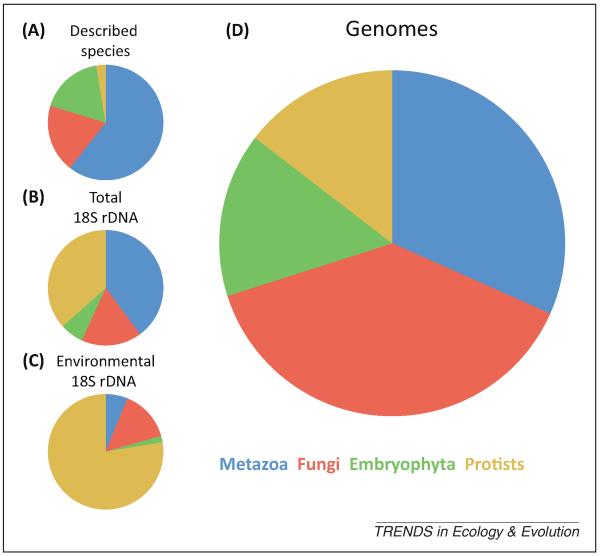
Figure 1.
Relative representation of metazoans, fungi, and land plants versus all the other eukaryotes in different databases. (A) Relative numbers of described species according to the CBOL ProWG (n = 2 001 573). (B) Relative numbers of 18S rDNA OTU97 in GenBank (n = 22 475). (C) Relative number of environmental 18S rDNA OTU97 in GenBank (n = 1165). (D) Relative number of species with a genome project completed or in progress according to GOLD, per eukaryotic group (n = 1758). Data in panels A–C are from [8]. Abbreviations: CBOL ProWG, Consortium for the Barcode of Life Protist Working Group; GOLD, Genomes OnLine Database; OTU97, operational taxonomic unit (>97% sequence identity).

