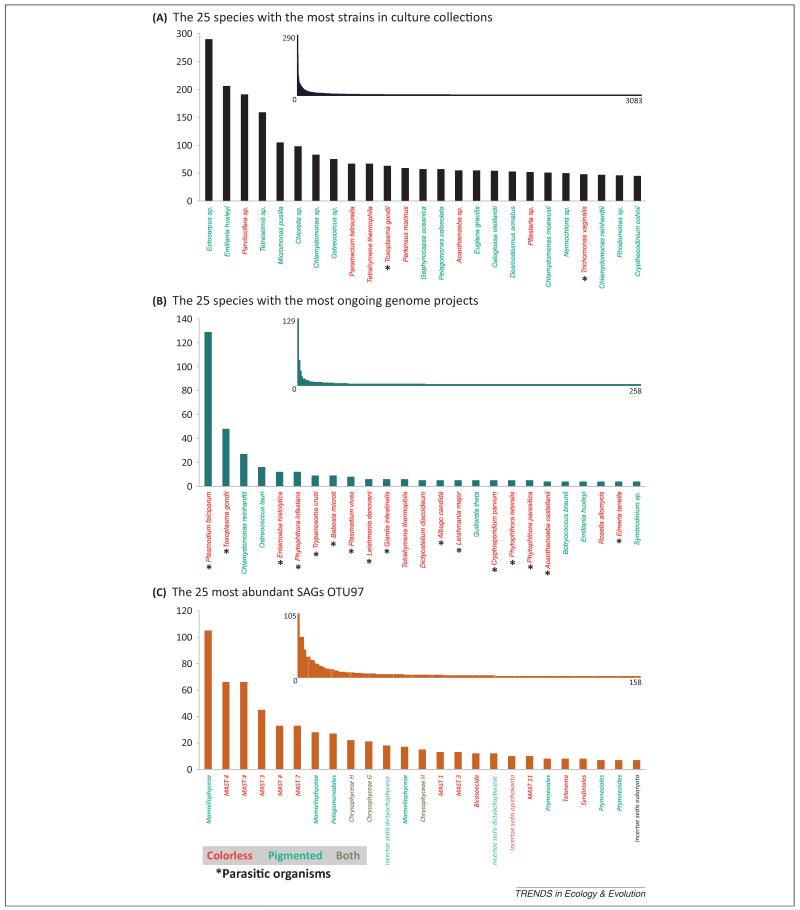
Figure 3.
Eukaryotic a diversity distribution among the analyzed databases. (A) The 25 species with the most strains represented in the analyzed culture collections. (B) The 25 speciesa with the most ongoing genome projects. (C) The 25 most abundant SAGs OTU97 in the analyzed dataset. Abbreviations: MAST, marine stramenopile; OTU97, operational taxonomic unit (>97% sequence identity); SAG, single amplified genome.
aSome strains are not described at the species level and have been grouped by genus. Therefore they may represent more than a single species.

