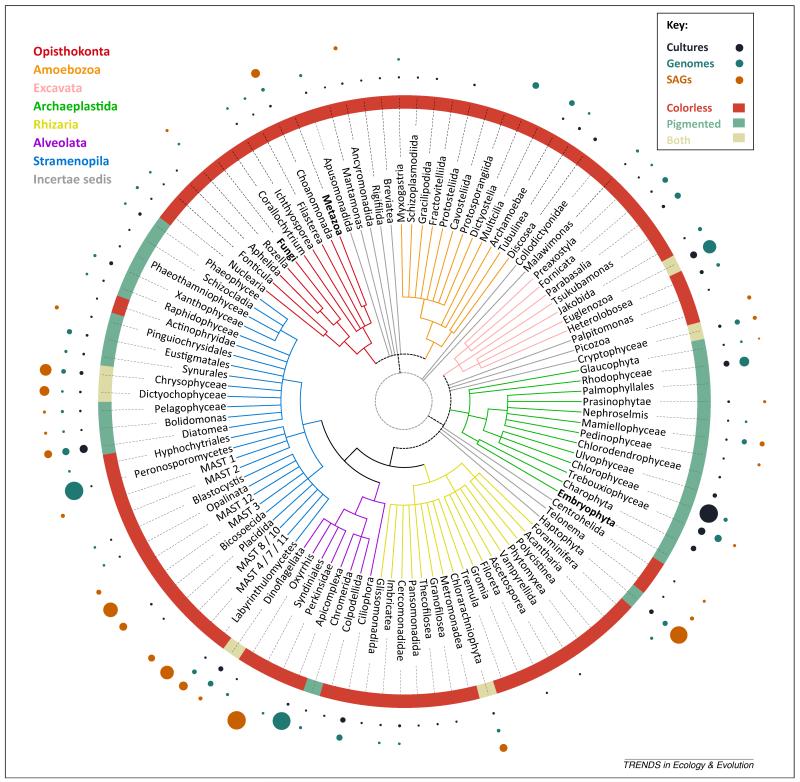
Figure 4.
The tree of eukaryotes, showing the distribution of current effort on culturing, genomics, and environmental single amplified genome (SAG) genomics for the main protistan lineages. Eukaryotic schematic tree representing major lineages. Colored branches represent the seven main eukaryotic supergroups, whereas grey branches are phylogenetically contentious taxa. The sizes of the dots indicate the proportion of species/OTU97 in each database. Culture data are from the analyzed publicly available protist culture collections (n = 3084). Genome data were extracted from the Genomes OnLine Database (GOLD) (n = 258) [9]. SAGs of OTU97 correspond to those retrieved during the Tara Oceans cruise (n = 158) (M.E.S., unpublished data). Taxonomic annotation of all datasets is based on [28]. The ‘big three’ (in bold) have been excluded from this analysis. Abbreviation: OTU97, operational taxonomic unit (>97% sequence identity).

