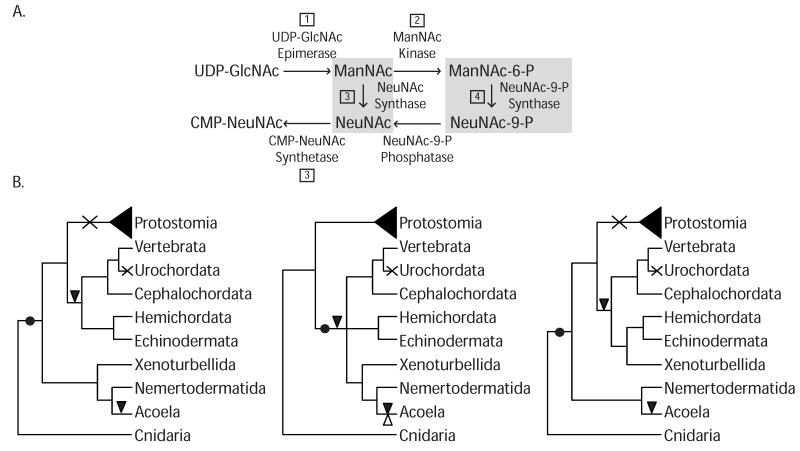
Figure 1.
A) Schematic representation of the biosynthesis pathway of CMP-NeuNAc both in bacteria and mammals (adapted from (Tanner 2005). Steps 1 and 2 are performed by GNE in deuterostomes. Step 3 is exclusive of Bacteria; while the additional step 4 has so-far only been described in mammals. B) Cladogram representing GNE evolution among the Bilateria according to different current phylogenetic scenarios. Black dot indicates acquisition of the GNE, cross shows secondary loss, black triangle shows intron gain and white triangle indicates intron loss.

