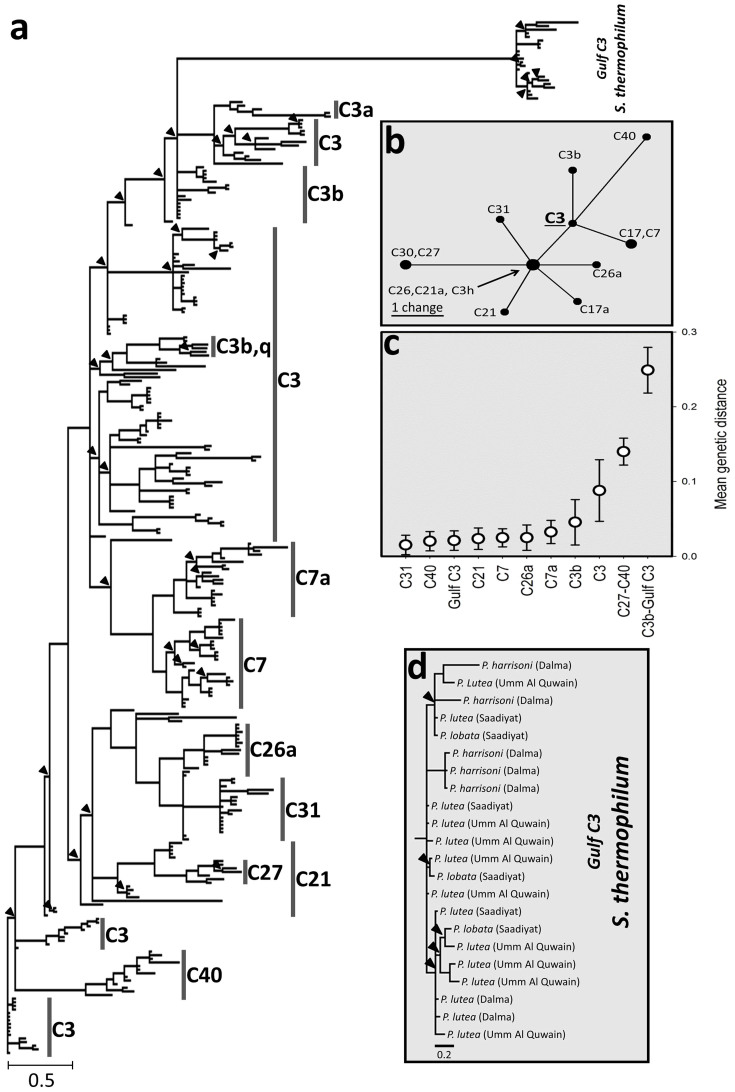
Figure 3. Resolution of phylogenies within ITS2 type C3 and closely related variants using the ITS2 and psbAncr markers.
(a) High resolution phylogeny of Gulf and non-Gulf ITS2 type C3 and closely related ITS2 type variants as estimated through Bayesian Inference of the chloroplast psbAncr. Sequences are annotated according to their ITS2 type. Gulf ITS2 type C3 sequences are annotated S. thermophilum as described in this report. Support for nodes is assessed using posterior probabilities (PP) presented on the tree as follows: 0.75-1.00, no annotation; 0.5-0.75, marked by (▴). No nodes had a support of less than 0.5. The tree is rooted according to an ITS2 type C3 sequence collected at the Great Barrier Reef (accession JQ043643). The tree showing the full details of node support and sample accession numbers is shown in Supplementary Fig. S2. Full details of the sequences used in the phylogenetic estimation are available in Supplementary Tables S3 and S4. (b) Maximum parsimony ITS2 haplotype network of the ITS2 types included in the phylogenetic analysis. (c) Within and between-group mean pairwise genetic differences with error bars (standard deviation). (d) Magnified region of the psbAncr tree including S. thermophilum samples annotated with host and location sampling information.

