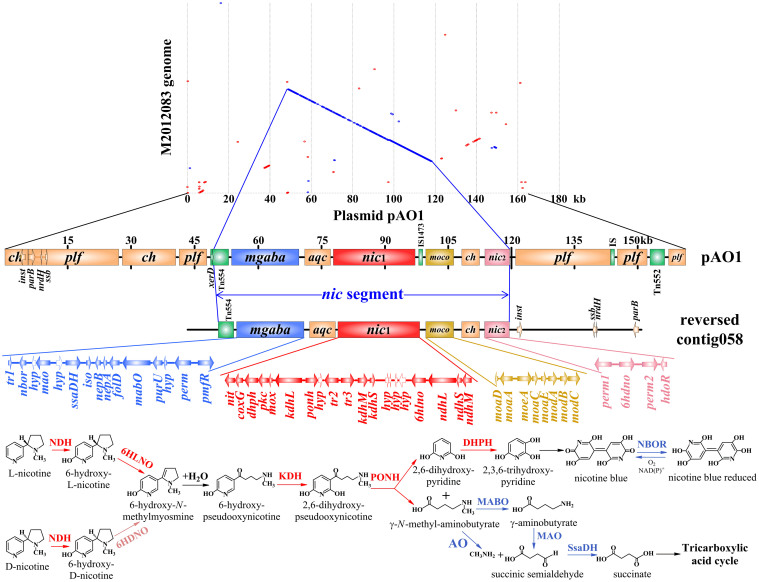
Figure 6. Comparison among the genome of M2012083 and plasmid pAO1.
The synteny plot of plasmid pAO1 versus M2012083 genome was generated by using MUMmer program. Red ringlets indicate the forward conserved genes between M2012083 genome and plasmid pAO1; blue ringlets indicate the reverse conserved genes between M2012083 genome and plasmid pAO1. The names, arrangements and functions of genes, and the nicotine-degrading pathway in Arthrobacter are shown according to Ganas P, Igloi GL and Brandsch R38. The rectangles in different colors represent gene clusters involved in carbohydrate catabolism (ch), plasmid function (plf), γ-N-methylaminobutyrate catabolism (mgaba), assembly and quality control of the (αβγ)2 holoenzyme complexes of NDH and KDH (aqc), nicotine degradation (nic1 and nic2), molybdenum cofactor biosynthesis (moco) and transposons (Tn554), and some insertion sequences (IS and IS1473). ORFs were indicated by arrows, and the hollow arrows represent hypothetical protein genes (hyp). See text and DataSet3 for details.

