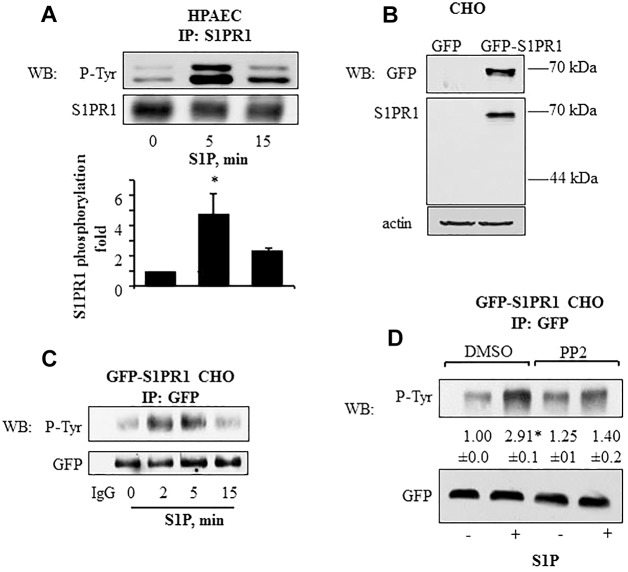
Fig. 1.
Tyrosine phosphorylation kinetics of S1PR1 in endothelial and CHO cells. (A) S1P induces S1PR1 tyrosine phosphorylation in HPAECs. HPAECs were serum starved for 1 h after which they were stimulated with 1 µM S1P for the indicated times. Cell lysates were immunoprecipitated (IP) with anti-S1PR1 antibody and immunoblotted (WB) with anti-phosphotyrosine (P-Tyr) or anti-S1PR1 antibodies. The bar graph shows mean±s.d. (n = 4) of the fold increase in S1PR1 tyrosine phosphorylation. *P<0.05 compared with unstimulated cells. (B,C) S1P induces tyrosine phosphorylation of GFP–S1PR1 in CHO cells. (B) CHO cells were stably transfected with GFP–S1PR1 as indicated in the Materials and Methods. Untransfected CHO cells served as control. Cell lysates were immunoblotted with anti-GFP and anti-S1PR1 to confirm expression. Immunoblotting with anti-β-actin antibody was used as a loading control. (C) CHO cells stably expressing GFP–S1PR1 were serum starved for 1 h and challenged with 1 µM S1P for indicated times. Lysates were immunoprecipitated with anti-GFP antibody, and immunoblotted for phosphotyrosine or GFP (loading control). immunoprecipitation with rabbit IgG served as negative control. Representative immunoblots from three independent experiments are shown. (D) GFP–S1PR1-expressing CHO cells were serum starved for 30 min followed by exposure to 5 µM PP2 for 45 min in serum-free medium. Cells were challenged with 1 µM S1P for 5 min and lysates were immunoprecipitated with anti-GFP antibody, and immunoblotted for phosphotyrosine or GFP (loading control) to determine phosphorylation. A representative immunoblot is shown. Numbers indicate the densitometric analysis of the fold change (±s.d.) in phosphorylation over that at 0 min in control cells from three individual experiments. *P<0.05 compared with unstimulated cells.

