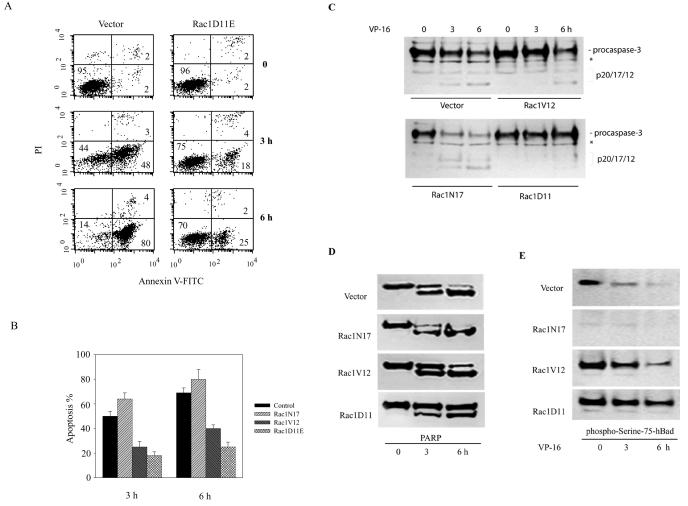
FIG. 2.
Rac1 activity modulates apoptosis induced by VP-16. (A) Apoptosis was assessed in control BL-41 cells and in BL-41 cells transfected with the caspase-3-resistant Rac1 mutant Rac1D11E by fluorescence-activated cell sorting analysis using FITC-annexin V and PI (see Materials and Methods and reference 46 for details). Cells were treated with 200 μg of VP-16/ml for 3 or 6 h and then were harvested. The percentage of each cell population is shown. Cells in the lower right fluorescence-activated cell sorting quadrant represent apoptotic cells. (B) Quantification of VP-16-induced apoptosis (as described for panel A) in BL-41 cells expressing endogenous Rac1 only, dominant-negative Rac1N17, constitutively active Rac1V12, or the caspase-3-resistant mutant Rac1D11E, as indicated. The results represent the means ± standard deviations from three independent experiments. (C and D) Measurement of procaspase-3 and PARP cleavage in control and Rac1-transfected cell lines expressing the various mutant proteins after treatment with VP-16 as indicated by Western blot immunoassay using anti-caspase-3 (C) and anti-PARP (D) antibodies. Caspase activity is indicated by the appearance of the p17/p12 caspase-3 cleavage fragments (D) and the 85-kDa PARP cleavage product. *, nonspecific band. (E) The level of endogenous Bad phosphorylation in apoptotic cells was assessed by subjecting whole-cell lysates to Western blot immunoassay using antibodies specific for p-Ser-75. All data are representative of at least three independent experiments.

