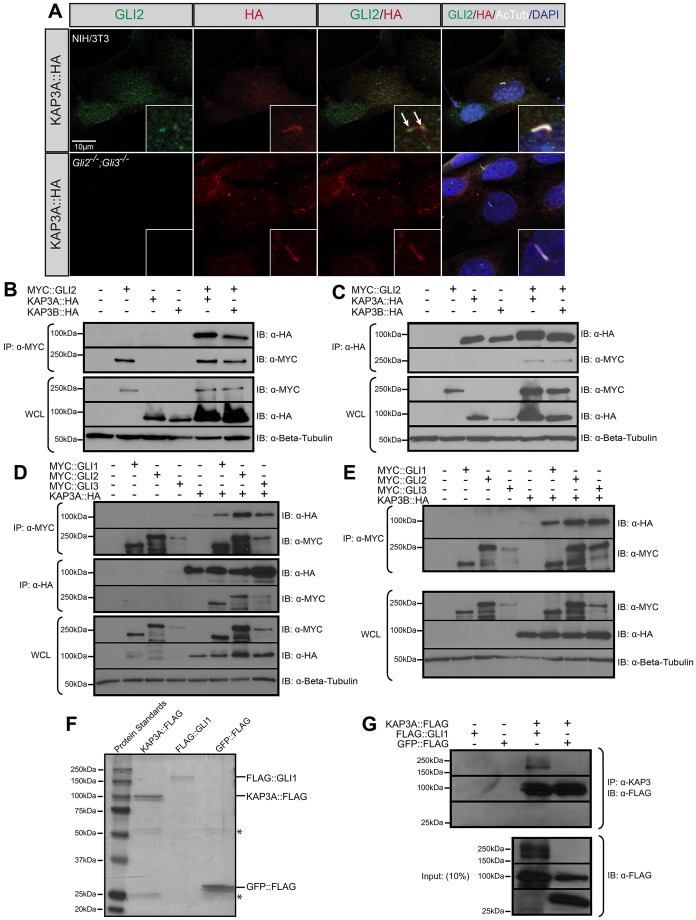
Fig. 2.
KAP3 localizes and interacts with mammalian GLI proteins. (A) Antibody detection of endogenous GLI2 in NIH/3T3 cells (upper row; green) or Gli2−/−;Gli3−/− MEFs (lower row; green) expressing HA-tagged KAP3A (KAP3::HA; red). Primary cilia are identified using antibodies directed against acetylated tubulin (AcTub; gray). DAPI denotes nuclei (blue). Insets represent high-magnification images of primary cilia. Arrows denote colocalization of KAP3A and GLI2 in primary cilia. (B) Immunoprecipitation of MYC-tagged GLI2 (MYC::GLI2) from COS-7 cells expressing either HA-tagged KAP3A (KAP3A::HA) or KAP3B (KAP3B::HA). (C) Immunoprecipitation of KAP3A::HA or KAP3B::HA from COS-7 cells co-expressing MYC::GLI2. (D) Immunoprecipitation of MYC::GLI1-3 or KAP3A::HA from COS-7 cells co-expressing MYC::GLI1-3 and/or KAP3A::HA. (E) Immunoprecipitation of MYC::GLI1-3 from COS-7 cells co-expressing MYC::GLI1-3 and/or KAP3B::HA. Immunoprecipitates (IP) and whole-cell lysates (WCL) were subjected to SDS-PAGE and western blot analysis (IB) using antibodies directed against MYC (α-MYC) and HA (α-HA). Antibody detection of β-tubulin (α-Beta-Tubulin) was used to confirm equal loading across lanes. (F) Gel Code Blue detection of affinity-purified KAP3A::FLAG, FLAG::GLI1 and GFP::FLAG from COS-7 cell lysates. Asterisks (*) denote FLAG antibody heavy and light chains eluted from the FLAG–agarose beads. (G) Immunoprecipitation (upper blots) of purified KAP3A::FLAG using an endogenous KAP3 antibody (IP: α-KAP3) followed by western blot analysis with anti-FLAG antibody (IB: α-FLAG) to detect KAP3A::FLAG, FLAG::GLI1 or GFP::FLAG. 10% of the inputs (lower blots) were visualized by western blot analysis to confirm equal protein levels. The molecular masses (in kDa) of protein standards are indicated at the left of each blot.

