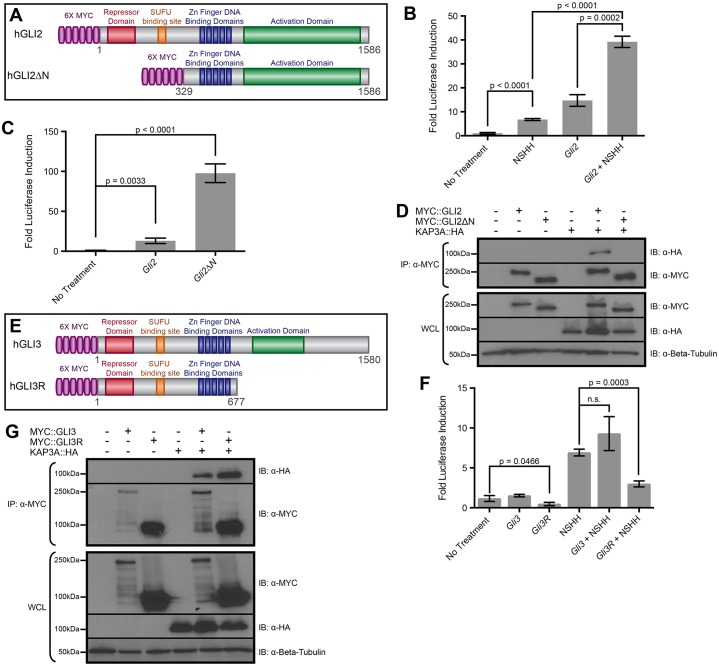
Fig. 4.
The N-termini of GLI2 and GLI3 interact with KAP3A. (A) Schematic of full-length and truncated human (h)GLI2 proteins. A 6×MYC epitope tag (purple) is present at the N-terminus of each GLI2 protein. Highly conserved GLI2 protein sequences include a transcriptional repressor domain (red, absent from hGLI2ΔN), SUFU binding site (orange, absent from hGLI2ΔN), five zinc-finger DNA-binding domains (dark blue), a phosphorylation cluster (light blue) and a transcriptional activation domain (green). (B) Luciferase activity readout of HH signaling following treatment of NIH/3T3 fibroblasts with NSHH after transfection with either empty vector (No Treatment) or Gli2-pCDNA3 (Gli2). HH pathway activity is measured as the fold luciferase induction. Data represent the mean±s.d. for triplicate samples from a single experiment and are representative of three independent experiments; P-values are indicated above the relevant treatment groups (Student's unpaired t-test). (C) Comparison of HH pathway activity in NIH/3T3 cells expressing hGLI2 or hGLI2ΔN. (D) Immunoprecipitation of MYC-tagged GLI2 (MYC::GLI2) or GLI2ΔN (MYC::GLI2ΔN) from COS-7 cells co-expressing HA-tagged KAP3A (KAP3A::HA). Immunoprecipitates (IP) and whole-cell lysates (WCL) were subjected to SDS-PAGE and western blot analysis (IB) using antibodies directed against MYC (α-MYC) and HA (α-HA). Antibody detection of β-tubulin (α-Beta-Tubulin) was used to confirm equal loading across lanes. The molecular masses (in kDa) of protein standards are indicated at the left of each blot. (E) Schematic of full-length and truncated human GLI3 proteins. (F) Luciferase activity readout of HH signaling following treatment of NIH/3T3 fibroblasts with NSHH after transfection with either empty vector (No Treatment), Gli3-pCDNA3 (Gli3) or Gli3R-pCDNA3 (Gli3R). HH pathway activity is measured as the fold luciferase induction. Data represent the mean±s.d. for triplicate samples in a single experiment and are representative of three independent experiments; P-values are indicated above the relevant treatment groups (Student's unpaired t-test). n.s., not significant (P>0.05). (G) Immunoprecipitation of MYC-tagged GLI3 (MYC::GLI3) or GLI3R (MYC::GLI3R) from COS-7 cells co-expressing KAP3A::HA.

