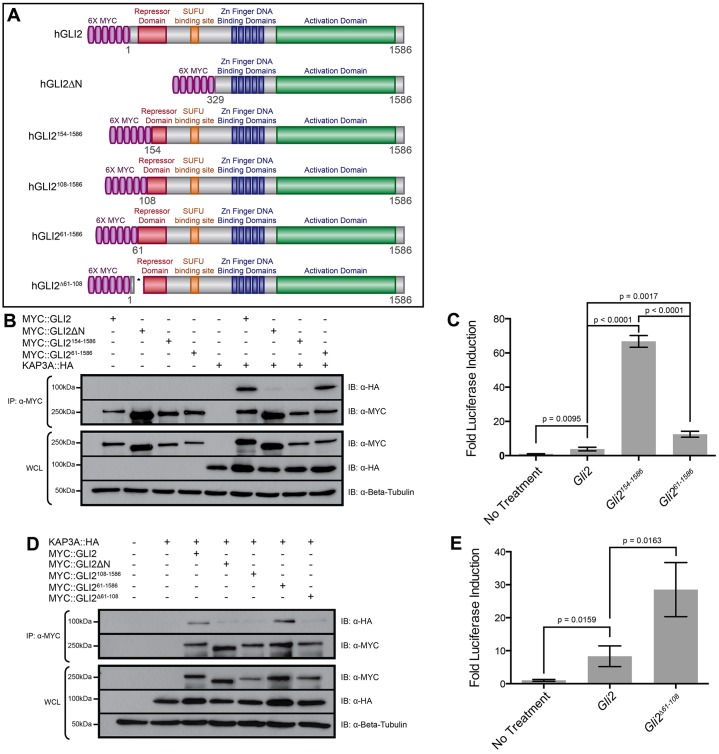
Fig. 5.
GLI2 interacts with KAP3A through an N-terminal domain that restricts GLI2 function. (A) Schematic of full-length and truncated human (h)GLI2 proteins. (B) Immunoprecipitation of MYC-tagged GLI2 (MYC::GLI2), GLI2ΔN (MYC::GLI2ΔN), GLI2154–1586 (MYC::GLI2154–1586) or GLI261–1586 (MYC::GLI261–1586) from COS-7 cells expressing HA-tagged KAP3A (KAP3A::HA). (C) Luciferase activity readout of HH signaling after transfection with either empty vector (No Treatment), Gli2, Gli2154–1586 or Gli261–1586. HH pathway activity is measured as the fold luciferase induction. Data represent the mean±s.d. for triplicate samples in a single experiment and are representative of three independent experiments; P-values are indicated above the relevant treatment groups (Student's unpaired t-test). (D) Immunoprecipitation of MYC::GLI2, MYC::GLI2ΔN, MYC::GLI2108–1586, MYC::GLI261–1586 or MYC::GLI2Δ61–108 from COS-7 cells expressing KAP3A::HA. Immunoprecipitates (IP) and whole-cell lysates (WCL) were subjected to SDS-PAGE and western blot analysis (IB) using antibodies directed against MYC (α-MYC) and HA (α-HA). Antibody detection of β-tubulin (α-Beta-Tubulin) was used to confirm equal loading across lanes. The molecular masses (in kDa) of protein standards are indicated at the left of each blot. (E) Comparison of full-length GLI2 and GLI2Δ61–108 activity in HH-responsive NIH/3T3 cells. Data represent the mean±s.d. for triplicate samples in a single experiment and are representative of three independent experiments; P-values are indicated above the relevant treatment groups (Student's unpaired t-test).

