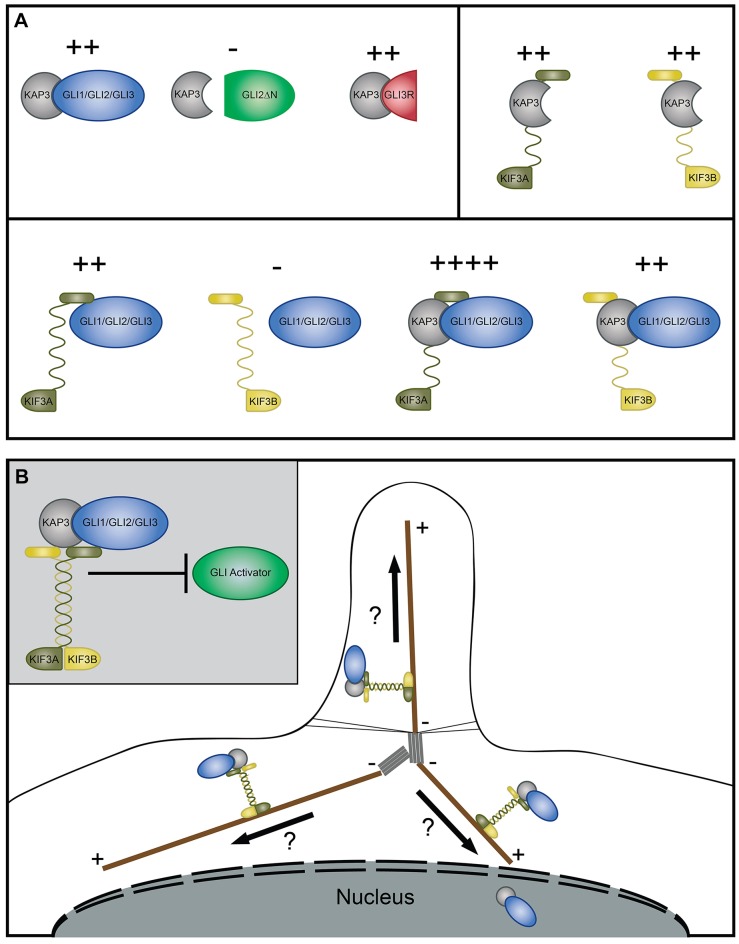
Fig. 8.
Model of GLI–kinesin-2 complex interactions and subcellular localization. (A) Schematic summary of biochemical interactions between GLI proteins (blue), KAP3 (gray), KIF3A (dark green) and KIF3B (yellow). Truncated versions of GLI proteins, GLI2ΔN and GLI3R, are represented in light green and red, respectively. Plus (+) and minus (−) represent the relative strength of interaction based on the immunoprecipitation studies, with − indicating no interaction and ++++ denoting the strongest interaction. (B) Schematic of the functional consequence of the KAP3–GLI interaction on GLI activator (green) and subcellular localization of the GLI (blue)–KAP3 (gray)–KIF3A (dark green)–KIF3B (yellow) complex. The primary cilium is represented by microtubules (brown) extending from basal bodies (gray) with the ciliary barrier depicted by thin black lines. Plus (+) and minus (−) depict microtubule directionality. Question marks denote putative plus-end trafficking roles for KIF3A–KIF3B–KAP3 in regulating GLI proteins based on biochemical, immunofluorescence and signaling studies.

