Figure 1.
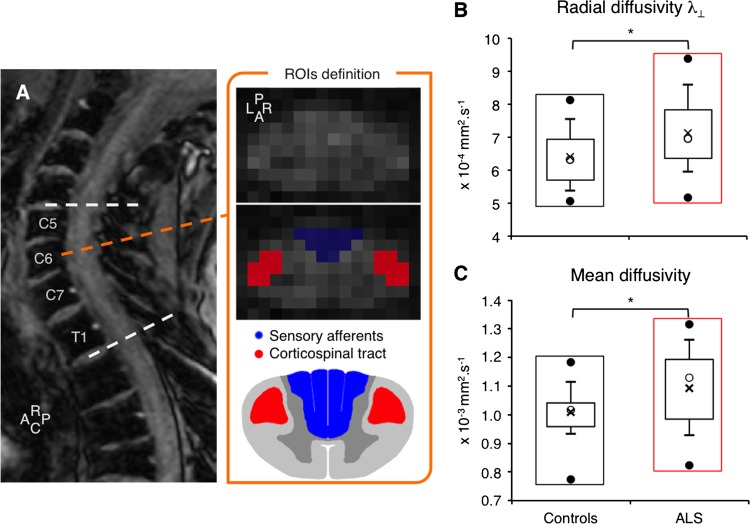
Spinal diffusion tensor imaging metrics. (A) T2-weighted MRI sagittal slice (rostro (R)—caudal (C) axis) and mean diffusion-weighted images (C6 vertebra level) in one patient with amyotrophic lateral sclerosis (ALS). For each level between C5 and T1 (dashed white lines), the posterior (P, in blue) and left (L) and right (R, in red) region of interests (ROIs) were drawn manually on the mean diffusion-weighted images to include most of the posterior column-medial lemniscus pathway (sensory pathways) and lateral corticospinal tracts (motor pathways), respectively. The posterior ROI was split in two parts for the right and left side of the spinal cord, according to the antero (A)—posterior axis and the slice centre of mass. Box plot charts showing distribution of data for the radial (B) and mean diffusivity (C) in controls (black rectangles) and in patients with ALS (red rectangles): the top and bottom line of the box correspond to the 75th centile (top quartile) and 25th centile (bottom quartile), respectively, and the open circle in the box, to the 50th centile (median). The two bars extend from the 10th centile (bottom centile) to the 90th centile (top centile). The bar caps delimit outliers. The top and bottom filled circles indicate the maximum and minimum values, respectively. The cross within the box indicates the arithmetical mean. *p<0.05.

