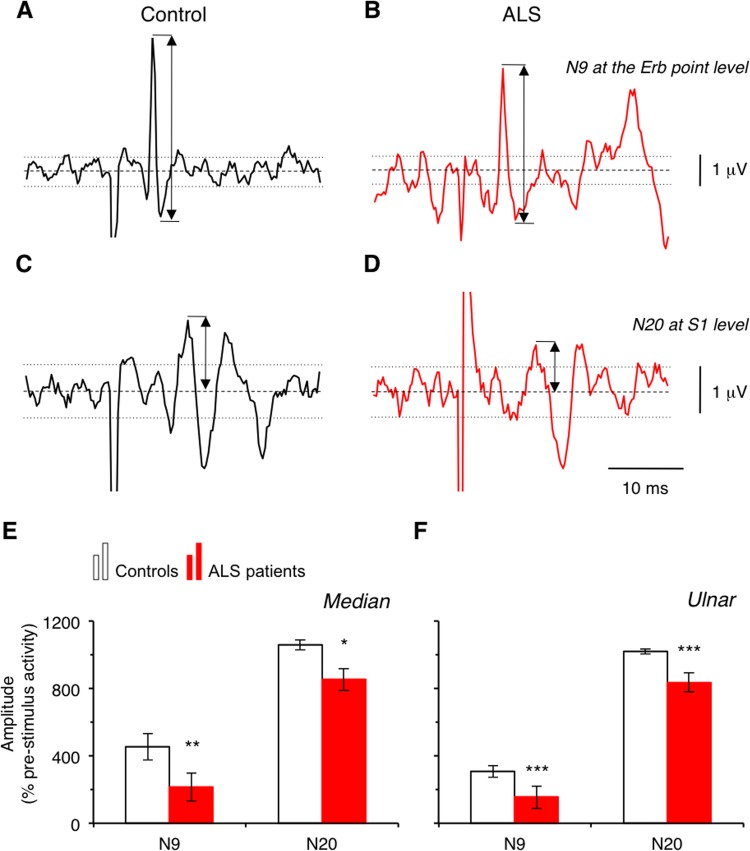
Figure 3.
N9 and N20 amplitude. Raw signal (in μV) from recordings at the Erb point level (A and B) and at cortical level (in front of S1, C and D) in one healthy subject (control, A and C; black lines) and in one patient with amyotrophic lateral sclerosis (ALS, B and D; red lines). Dashed lines indicate the 0 level. Upper and lower dotted lines indicate +2×SD and −2×SD levels, respectively. Group data showing the mean amplitude of N9 (left) and of N20 (right) normalised to prestimulus activity in controls (open columns) and in patients with ALS (red columns) after median (E) and ulnar nerve stimulation (F). Vertical bars are±1 SEM. *p<0.05, **p<0.01 and ***p<0.001.

