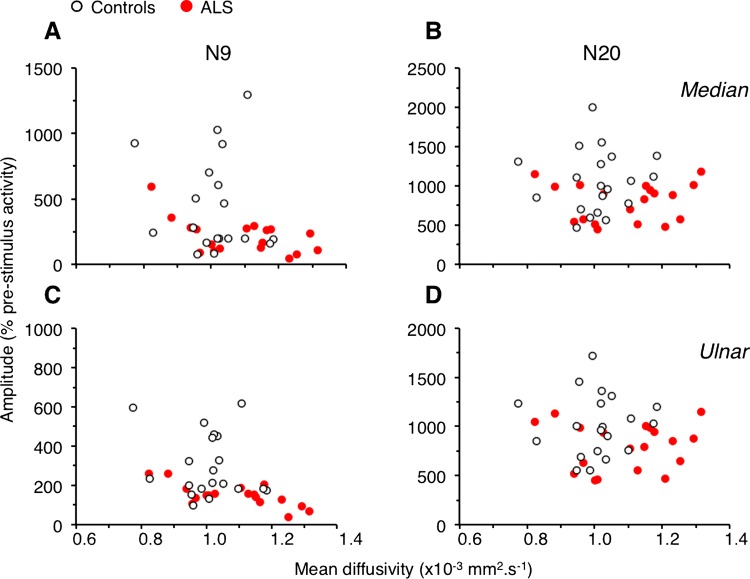
Figure 4.
Relationships between diffusion tensor imaging and electrophysiological metrics. N9 (A and C) and N20 (B and D) amplitude (% 2×SD of the prestimulus activity) plotted against the mean diffusivity (×10−3 mm2/s) for median nerve (A and B) and for ulnar nerve (C and D). Each open circle represents one control and each red circle, one patient with amyotrophic lateral sclerosis.

