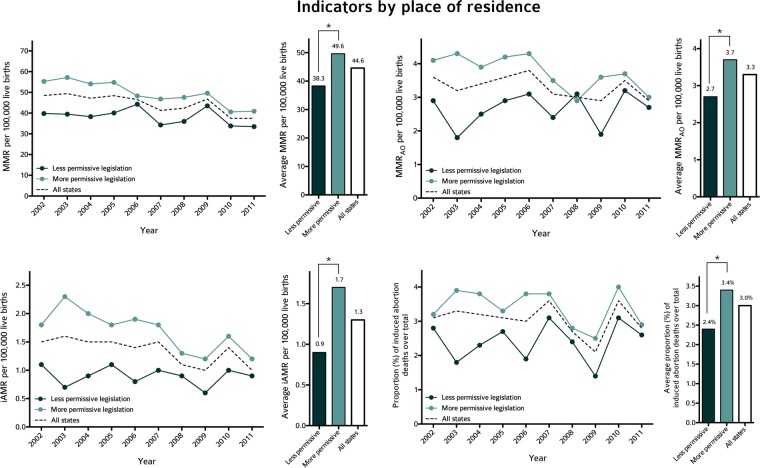
Figure 1.
Mortality ratios and the proportion of abortion-related deaths by place of residence in states with less and more permissive abortion legislation. Line charts illustrate trends in MMR (top-left panel), MMRAO (top-right panel), iAMR (bottom-left panel) and the proportion of abortion-related deaths (bottom-right panel) by place of residence between 2002 and 2011 in Mexican states, grouped as with less permissive (in dark green) or more permissive (in cyan) in terms of abortion legislation in their criminal code (see Materials and methods). For comparison, trends for the whole Mexican country (all states) are depicted as dotted lines. Bar charts show average ratios and proportions of abortion-related deaths for each group (dark green and cyan bars, respectively), and the whole Mexican country (hollow bars). *p<0.05 using Z-test. iAMR, induced abortion mortality ratio; MMR, maternal mortality ratio; MMRAO, MMR with an abortive outcome.

