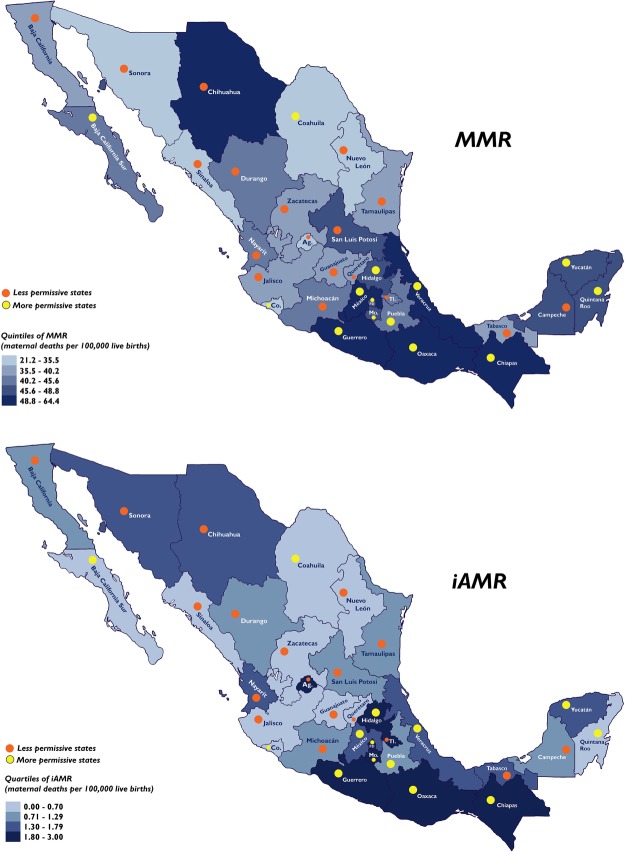
Figure 3.
Average mortality ratios in states with more or less permissive abortion legislation between 2002 and 2011. Political maps of Mexican states are shown for average MMR (top panel) and average iAMR (bottom panel) for the 2002–2011 period, indicating whether they exhibit less (orange dots) or more (yellow dots) permissive abortion legislation, in terms of their criminal code (see Materials and methods). Increasing blue colour indicates an increase in MMR or iAMR on a quintile or quartile scales (see the legend of each panel). Ag., Aguascalientes; Co., Colima; FD., Federal District; iAMR, induced abortion mortality ratio; MMR, maternal mortality ratio; Mo., Morelos; Tl., Tlaxcala.

