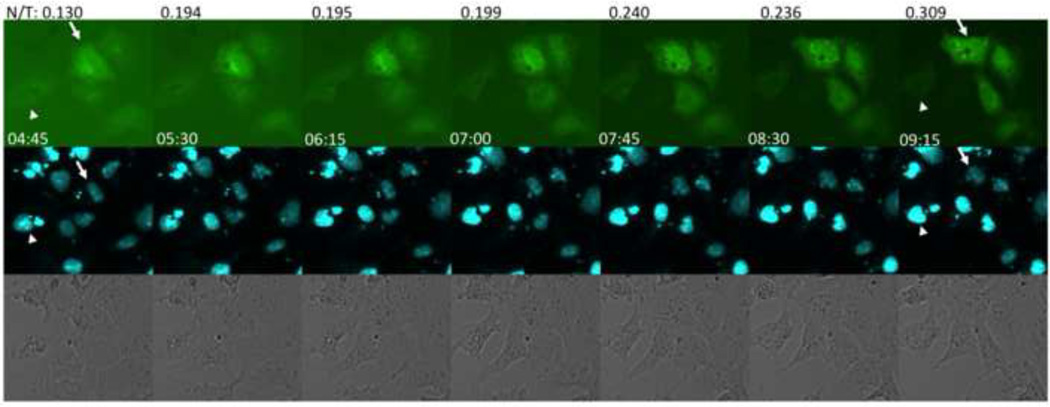
Figure 2.
Kinetics of nuclear localization of GFP after DENV infection. Vero cells transfected with p4B5-EGFP were infected with DENV-2 16681 and sequential images were acquired to assess the time for GFP to localize into the nucleus. Each set of images shows the expression of GFP in p4B5-EGFP transfected cells (top row), nuclear stain using NucBlue (middle row) and transmitted images (bottom row) at each time point. Time after addition of virus to the culture is located at the lower left of each image (magnification, ×20). Nuclear/total fluorescence (N/T) was calculated at each time point for a representative cell (arrow). The arrowhead shows a cell that remains uninfected over time. Data are representative of at least five experiments.

