
Figure 3.
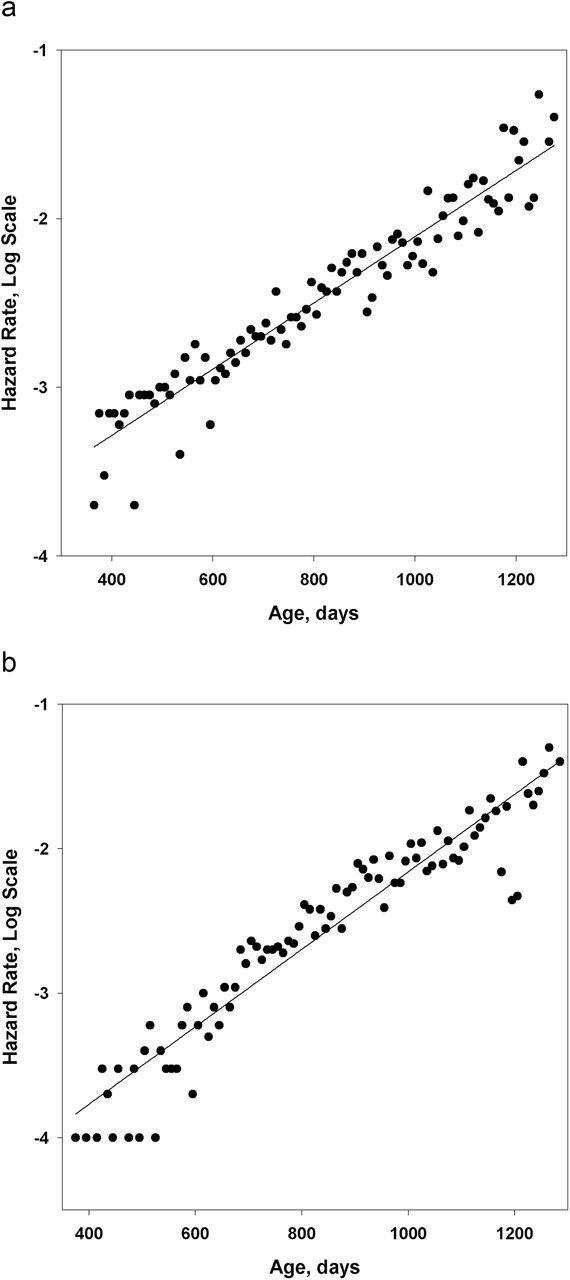
Hazard rate (measured for 10-day age interval) as a function of age. Mouse data, Interventions Testing Program controls. Note that mortality fits well with the straight line in semi-log scale, as predicted by the Gompertz model. (a) Males. (b) Females.