Figure 2.
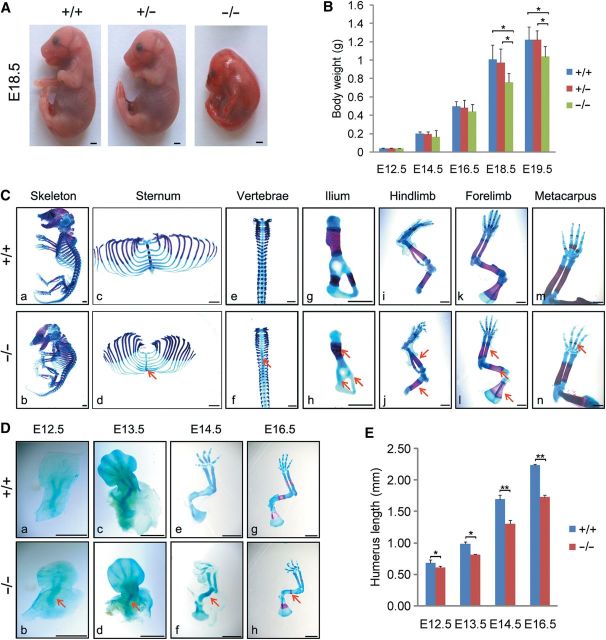
Dwarfism and developmental defects of skeleton in Jmjd3−/− mice. (A) Gross appearance of Jmjd3+/+, Jmjd3+/−, and Jmjd3−/− littermates at E18.5. Scale bar, 1 mm. (B) Quantification of body weight of Jmjd3+/+, Jmjd3+/−, and Jmjd3−/− embryos at E12.5 (n = 4), E14.5 (n = 8), E16.5 (n = 6), E18.5 (n = 6), and E19.5 (n = 4). *P < 0.05. Error bar indicates the standard error (SE) of the mean. Statistical significance is determined by two-tailed Student's t-test. (C) Alizarin red (bone mineralization) and alcian blue (cartilage) stained skeleton of E18.5 WT (upper panels) and Jmjd3−/− (lower panels) littermates (a, b). Magnified images are shown for ribs and sternum (c, d), vertebrae (e, f), ilium (g, h), hindlimbs (i, j), forelimbs (k, l), and metacarpus (m, n). Red arrows indicate a delay in the formation of the primary ossification center of Jmjd3−/− skeletal elements. Scale bar, 1 mm. (D) Skeleton preparations of forelimbs of Jmjd3+/+ and Jmjd3−/− embryos were stained by alcian blue and/or alizarin red staining at E12.5 (a, b), E13.5 (c, d), E14.5 (e, f), and E16.5 (g, h). Red arrows indicate smaller and shorter humeri of Jmjd3−/− embryos. Scale bar, 1 mm. (E) Quantification of length of Jmjd3+/+ and Jmjd3−/− humeri at E12.5, E13.5, E14.5, and E16.5. * P < 0.05, ** P < 0.01. Error bar indicates the SE (n ≥ 4). Statistical significance is determined by two-tailed Student's t-test.

