Figure 3.
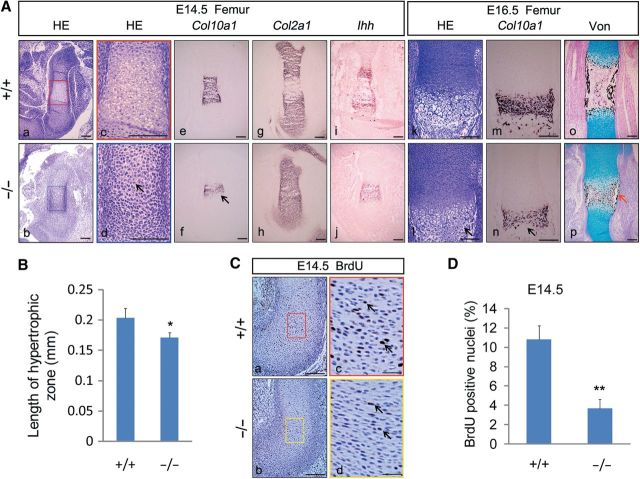
Severely reduced hypertrophy and proliferation of chondrocytes in Jmjd3−/− mice. (A) Representative H&E staining (a–d, k, l), in situ hybridization with probes of Col10a1 (e, f, m, n), Col2a1 (g, h), and Ihh (i, j), and Von Kossa staining (o, p) at E14.5 (a–j) and E16.5 (k–p) femurs of WT (upper) and Jmjd3−/− (lower) littermates. The boxed regions in a and b are magnified in c and d with matched color rim, respectively. Black arrows denote a delay of chondrocyte hypertrophy in Jmjd3−/− mice. Red arrows denote decreased mineralization in periosteum of Jmjd3−/− femur. Scale bar, 200 μm. (B) Quantification of the length of hypertrophic chondrocyte zones at E16.5 WT and Jmjd3−/− femur. * P < 0.05, two-tailed Student's t-test. Error bar indicates the SE (n = 3). (C) Immunohistochemistry of BrdU-labeled chondrocytes counterstained with hematoxylin in humeri sections of WT (upper) and Jmjd3−/− (lower) littermates at E14.5. The boxed regions in the left panels are magnified in the right panels with matched color rim, respectively. Arrows indicate BrdU-positive nuclei. Scale bar, 200 μm in a, b and 50 μm in c, d. (D) Quantification of proliferation rate in cartilage growth plate, represented by the percentage of BrdU-positive cells in WT and Jmjd3−/− humeri sections at E14.5. **P < 0.01, two-tailed Student's t-test. Error bar indicates the SE (n = 3).

