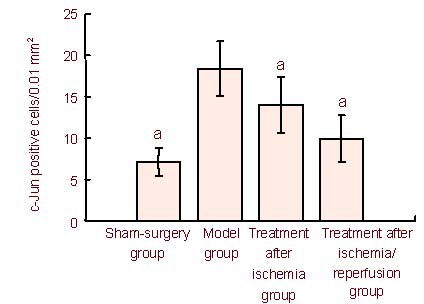
Figure 2.

Number of c-Jun-positive cells in the mouse hippocampus. Data are expressed as mean ± SD. Differences among multiple groups were compared with one-way analysis of variance, and differences between groups were further compared with the q test. aP < 0.01, vs. model group.
