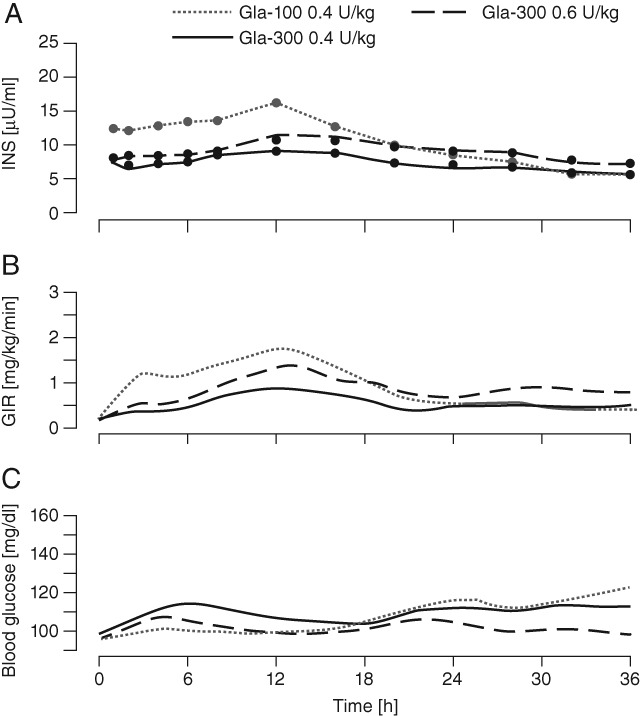
Figure 2.

Serum insulin glargine concentration (INS), glucose infusion rate (GIR) and blood glucose profiles after a single dose in the Japanese study. (A) Median INS profiles (linear scale) with lower limit of quantification (LLOQ) of 5.02 µU/ml; (B) mean smoothed [locally weighted regression in smoothing scatterplots (LOESS) factor 0.15] 36-h body-weight-standardized GIR profiles; (C) mean smoothed (LOESS factor 0.15) 36-h blood glucose profiles.
