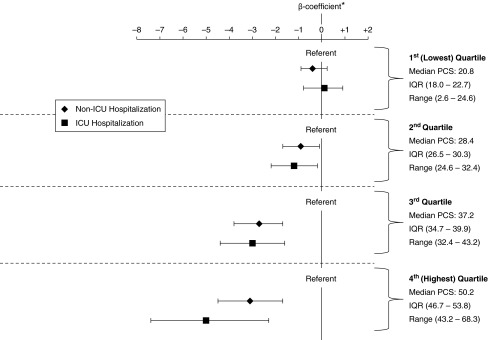
Figure 3.

Differences in Physical Component Summary (PCS) score, stratified by quartiles of most recent prior PCS scores. *P value for interaction term of stratified most recent prior PCS score and hospitalization status in adjusted model < 0.001. Shown are β-coefficients and 95% confidence intervals for models stratified by quartile of most recent prior PCS score, adjusted for a priori confounders; ICU = intensive care unit; IQR = interquartile range.
