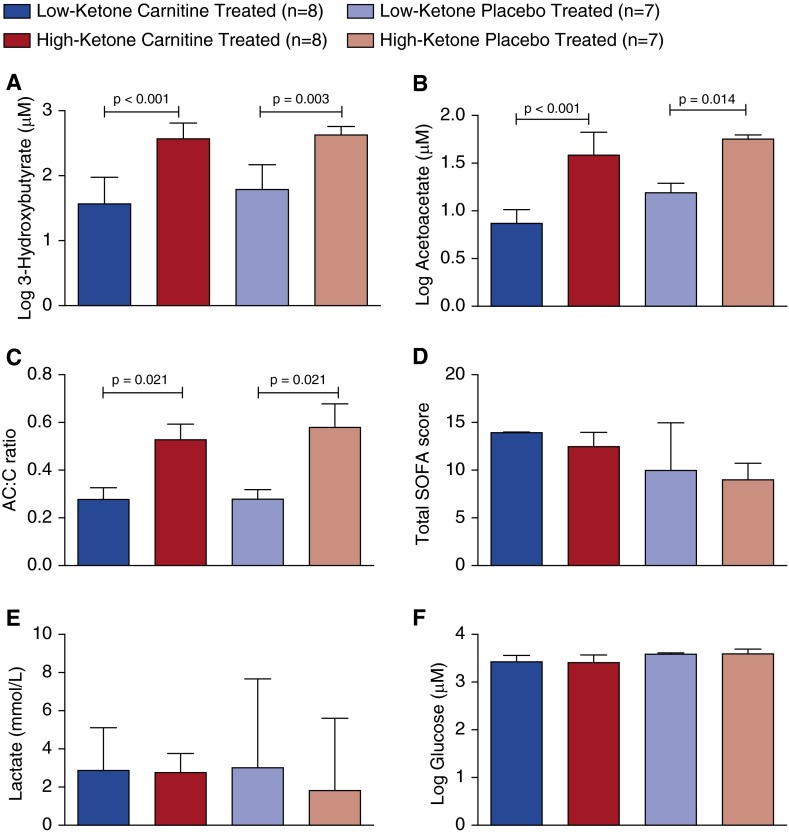
Figure 4.
(A) 3-Hydroxybutyrate (3-OHB) and (B) acetoacetate concentrations and (C) acetylcarnitine–carnitine (AC:C) ratios of placebo- and l-carnitine-treated patients who were categorized as either high or low ketone, based on the 3-OHB concentration at T0 (before treatment) (see text). The higher levels of ketone bodies and AC:C ratios suggest that high-ketone patients had a greater disruption in metabolic homeostasis than did low-ketone patients. This was not differentiated by (D) the T0 total SOFA scores, (E) point-of-care lactate concentrations, or (F) glucose concentrations as measured by nuclear magnetic resonance because they were not different across groups. SOFA = Sequential Organ Failure Assessment.

