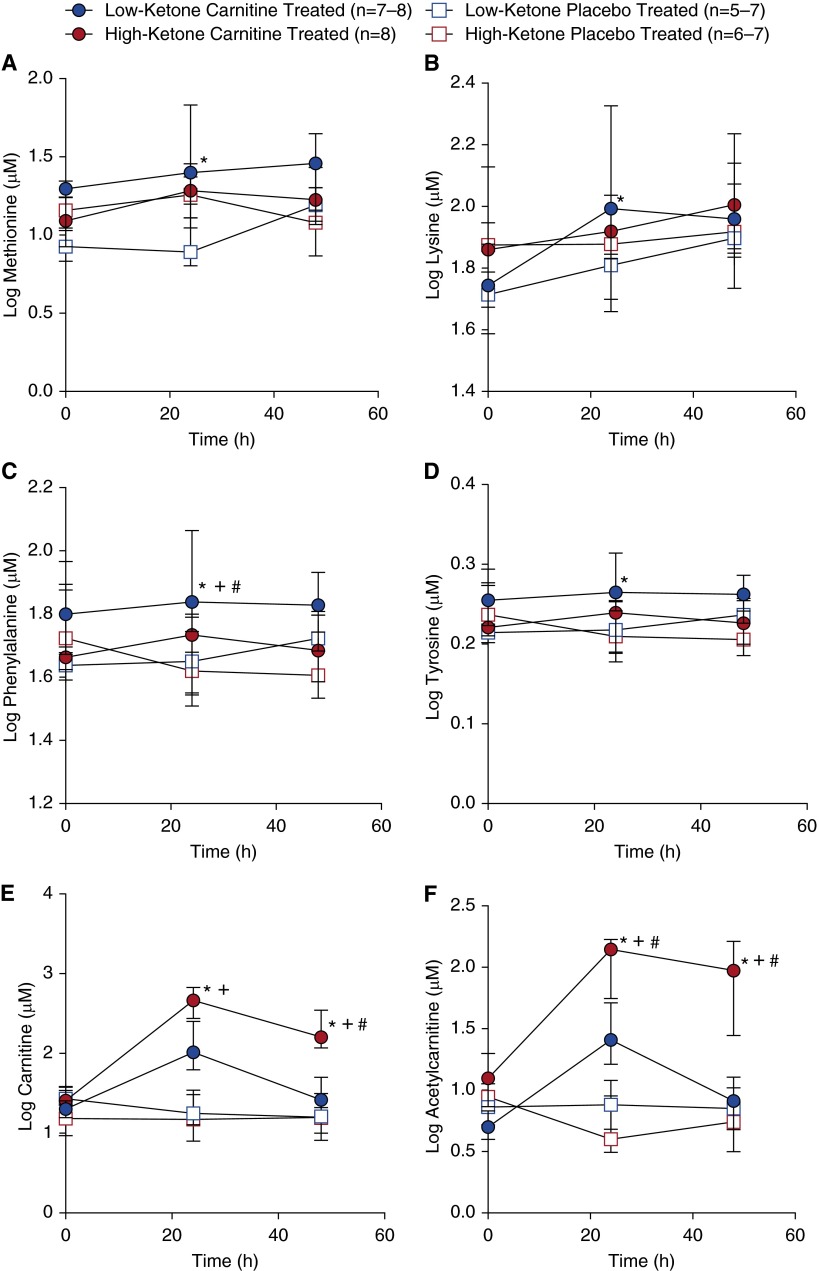
Figure 5.
Metabolite profiles of patients with septic shock and high or low ketones treated with l-carnitine were different from those of placebo-treated patients. (A) Methionine was increased in low-ketone, l-carnitine-treated patients compared with low-ketone, placebo-treated patients at T24 (24 [±4] h after treatment) (*P = 0.021). There was also a trend toward (B) increased lysine in the low-ketone, l-carnitine-treated patients (*P = 0.078 vs. low-ketone, placebo-treated patients). Methionine and lysine are precursors of endogenous carnitine synthesis. At T24, (C) phenylalanine trended higher (T24) in low-ketone, l-carnitine-treated patients than in high-ketone, l-carnitine-treated patients (*P = 0.051), low-ketone, placebo-treated patients (+P = 0.078), and high-ketone, placebo-treated patients (#P = 0.010). (D) Tyrosine followed a similar trend to phenylalanine in which low-ketone, l-carnitine-treated patients had higher levels at T24 compared with high-ketone, l-carnitine-treated patients (*P = 0.008). Phenylalanine and tyrosine, which can be synthesized from phenylalanine, are proteinogenic amino acids and participate in the synthesis of catecholamines. High-ketone, l-carnitine-treated patients had higher carnitine (E) levels compared with low-ketone, L-carnitine-treated patients (*P = 0.003) and high- and low-ketone, placebo-treated patients (+P < 0.001) at T24 and low-ketone L-carnitine, low-ketone placebo, and high-ketone placebo at T48 (*+#P < 0.0001). A similar pattern was evident in acetylcarnitine (F) concentration in which the T24 and T48 level in high-ketone, L-carnitine-treated patients was higher compared with low-ketone L-carnitine-treated patients (*P = 0.001 at T24; *P < 0.0001 at T48), low-ketone, placebo-treated patients (+P = 0.008 at T24; +P < 0.0001 at T48) and high-ketone, placebo-treated patients (#P < 0.001 at both T24 and T48). At no time were there differences between the low- and high-ketone, placebo-treated groups. There were also no differences in these metabolite levels between groups at T0 (before treatment). Data represent medians ± the interquartile range.

