
Figure 3.
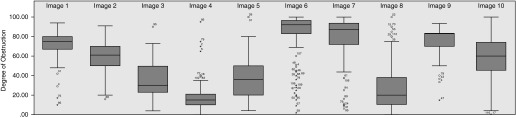
Distribution of estimates by image number. All individual estimates for each image are included in conventional box plots. The box designates the middle 50th percentile (25th–75th percentile), with a solid black line representing the median estimate. The whiskers denote 1.5 × interquartile range (IQR). Outliers are labeled with respondent identification number. Circle indicates an outlier, whereas extreme outliers are those outside of 3 × IQR, and are indicated with an asterisk.