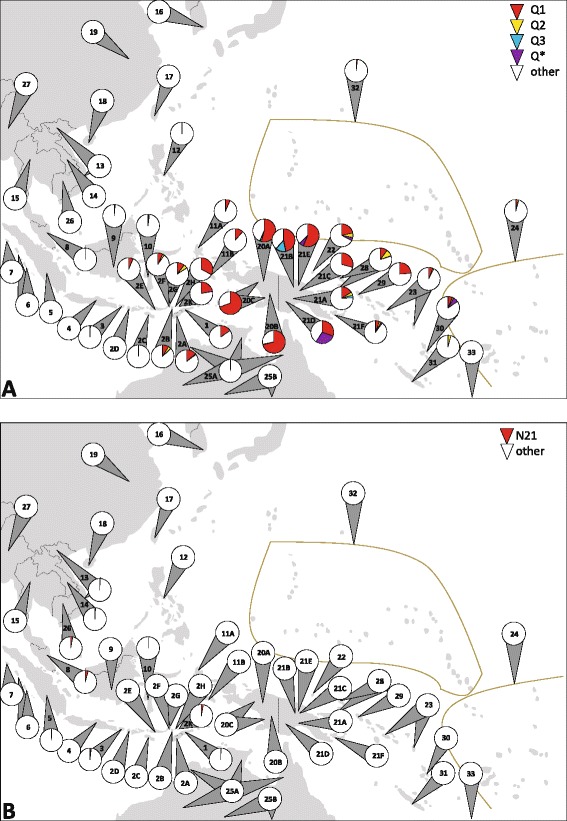
Figure 7.

Distribution of mtDNA haplogroups Q and N21 in East Timor and surrounding populations. (A) Haplogroups Q1-Q3. Unassigned/inconclusive Q samples were denoted as “Q*”; (B) Haplogroup N21. All available information was considered (reading frames varied). Frequencies in populations are indicated by colored circle segments. See legends for color codes. Population reference numbers located within a circle indicate that the analyzed haplogroup(s) were not found in this population. For the populations included, see Figure 5. For details and references, see Additional file 11.
