
Figure 1.
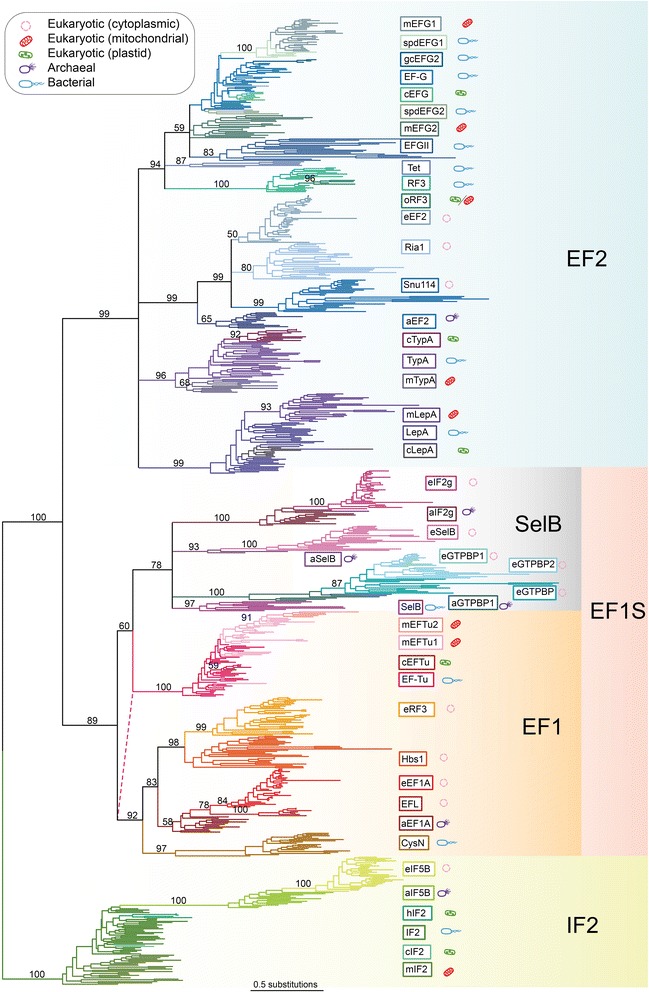
The trGTPase superfamily tree. The tree shown is an unrooted maximum likelihood phylogeny of trGTPase subfamilies from across the tree of life. Numbers on branches show bootstrap support from 100 replicates. Nodes separating subfamilies with less than 50% bootstrap support have been collapsed. The pink dotted line shows an alternative position for the clade containing bacterial and organellar EF-Tu, as supported by operon structure. Branch lengths are proportional to the number of amino acid substitutions (see lower scale bar). The icon next to the subfamily name indicates the domain of life and known or predicted subcellular compartment in which that trGTPase is found, as per the inset box.