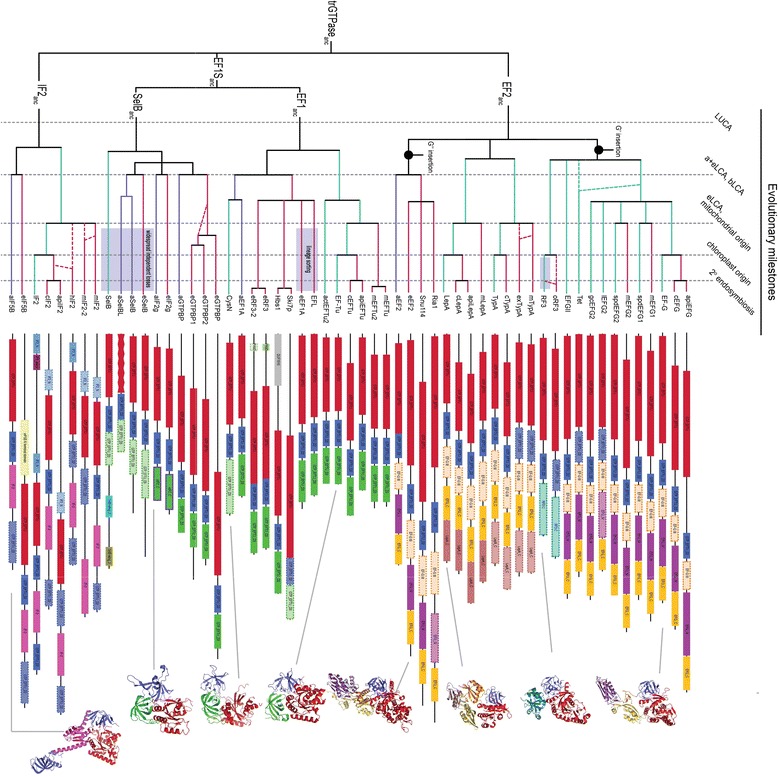
Figure 2.

Relative timeline of trGTPase diversification. The diagram summarizes evidence from phylogenetic relationships, domain architecture, transit peptide prediction and taxonomic distributions to show the relative divergence times of trGTPase families and subfamilies. Vertical dotted lines indicate major milestones in the evolution and diversification of life on earth, while horizontal branches are lineages of trGTPases in bacteria (green), archaea (blue) and eukaryotes (red). The subscript protein name suffix “anc” stands for ancestral. The tree assumes that archaea and eukaryotes share a common relative to the exclusion of bacteria. Branch lengths and time between ancestors are not to scale. Branches with dashed lines show uncertainties in relationships, and shading shows cases of particularly high lineage specific loss. LCA stands for last common ancestor, with bLCA being the ancestor of bacteria, eLCA being the ancestor of eukaryotes, aLCA being the ancestor of archaea, and a+eLCA being the ancestor of all archaea and eukaryotes. Typical subfamily domain structures are shown to the right of the tree. Boxes with solid borders show domains that are predicted with PFam. Where the domains are present but do not hit PFam HMMs, the boxes are shown with dotted borders. The G domain (Pfam name GTP_EFTU) of aSelbL is shown with an undulating border to indicate particular divergence in this subfamily. Protein structures are shown on the far right, and are linked with a grey line to their respective subfamily. Protein Data Bank IDs for the structures are as follows: EF-G: 1DAR [14], RF3: 2H5E [15], LepA: 2YWE, eEF2: 1N0V [16], EF-Tu: 1EXM [17], CysN: 1ZUN [18], aIF2g: 3PEN, aIF5B: 1G7R [19].
