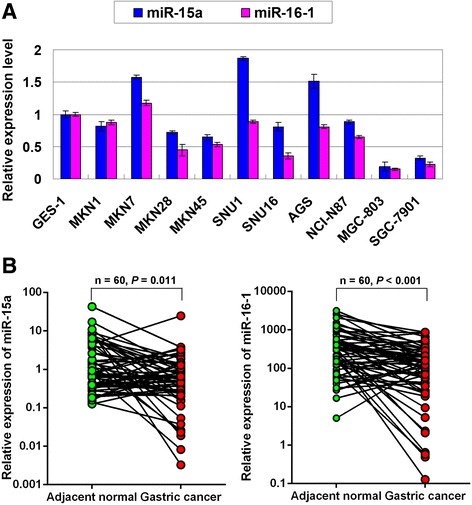
Figure 1.

miR-15a and miR-16-1 show decreased expression in GAC. (A) The expression of miR-15a and miR-16-1 in 10 GAC cell lines compared with GES-1 cells. The standard deviations (SDs) were achieved by the values in triplicate wells. (B) Expression of miR-15a and miR-16-1 in paired primary GAC samples (n = 60; miR-15a, P = 0.011; miR-16-1, P < 0.001).
