Figure 2.

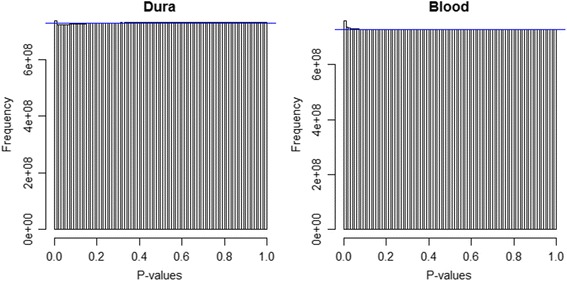
Trans-eQTL p-value histograms. Histogram of trans-eQTL p-values for dura (left) and blood (right) tissue. The horizontal blue line corresponds to a uniform distribution of p-values.

Trans-eQTL p-value histograms. Histogram of trans-eQTL p-values for dura (left) and blood (right) tissue. The horizontal blue line corresponds to a uniform distribution of p-values.