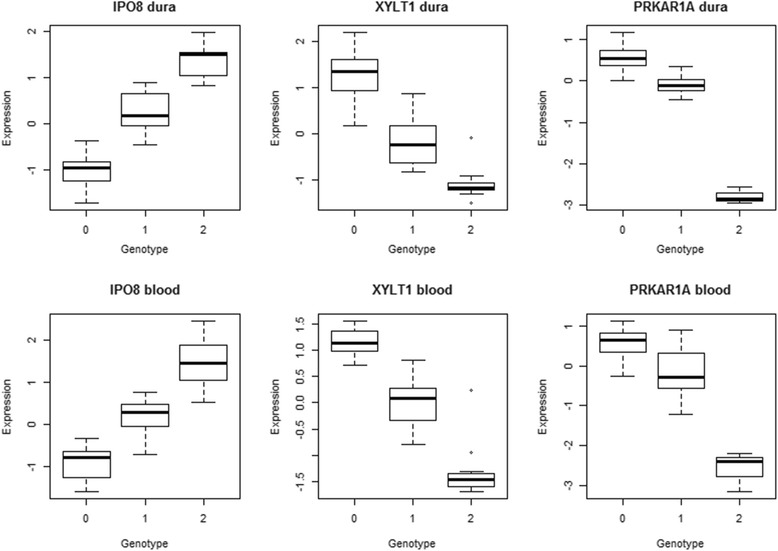
Figure 5.

Expression vs. genotype boxplots. Boxplots show the association between IPO8 expression and the SNP rs10743724, between XYLT1 expression and the SNP rs1045885, and between PRKAR1A expression and the SNP rs2302234, for dura (top) and blood (bottom) tissues. Expression values are z-standardized after preprocessing. The genotype is coded by number of copies of the minor allele (0, 1, or 2). All plots show a clear trend.
