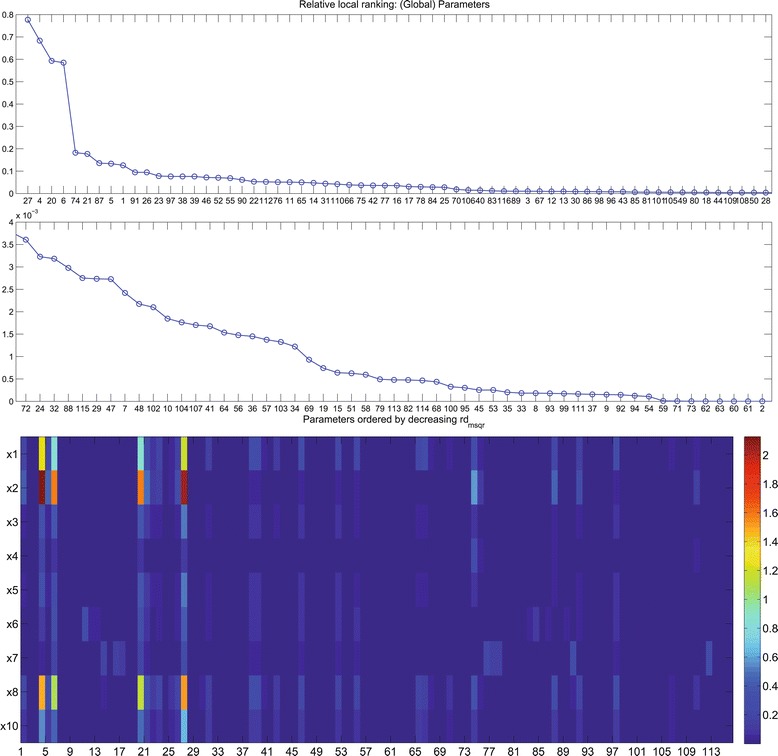
Figure 1.

Benchmark 2: sensitivities. The two panels on top show the local rank of the parameters, i.e., the parameters ordered in decreasing order of their influence on the system’s behaviour (, as defined in equations (9) and (10)). Note that the middle panel is a continuation of the upper one with a smaller y-axis scale. The array in the bottom panel shows the sensitivity of the 9 state variables (metabolite concentrations, in columns) of the model with respect to the 116 parameters. The colour bar in the right shows the sensitivity range: high sensitivities are plotted in red, low sensitivities in blue.
