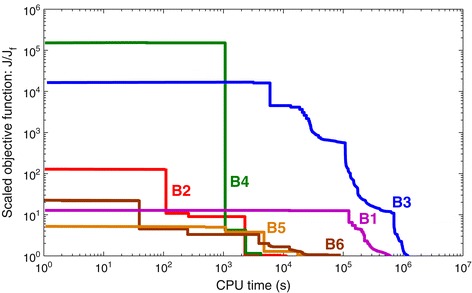
Figure 3.

Convergence curves. Representative results of parameter estimation runs of the six benchmarks, carried out with the eSS method. The curves plot the (logarithmic) objective function value as a function of the (logarithmic) computation time. For ease of visualization, the values in the curves have been divided by the final value reached by each of them, i.e. the y axis plots J/J f. Note that, since the benchmarks have different number of variables and data points, and different noise levels, the objective function values are not equivalent for different models. Results obtained on a computer with Intel Xeon Quadcore processor, 2.50 GHz, using Matlab 7.9.0.529 (R2009b) 32-bit.
