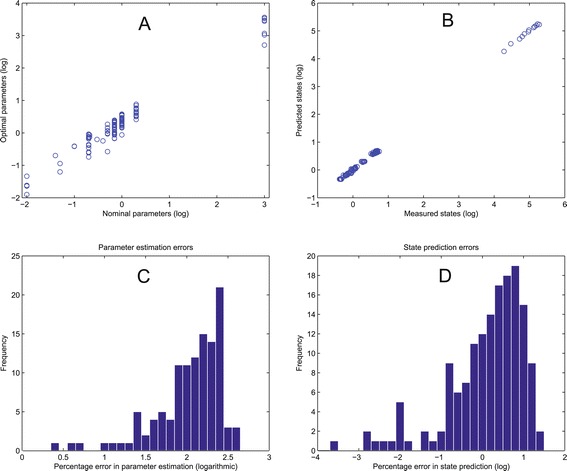
Figure 6.

Benchmark 4, typical parameter estimation results. (A) Optimal vs. nominal parameters. (B) Pseudo-experimental (“measured states”) vs. simulated data (“predicted states”). (C) Errors in the parameters: histogram of the differences between the nominal parameter vector and the optimal solution, in %. (D) Errors in the predictions: histogram of the difference between pseudo-experimental and simulated data, in %.
