
Figure 2. Validation of successful WGA and WTA from the same single cell.
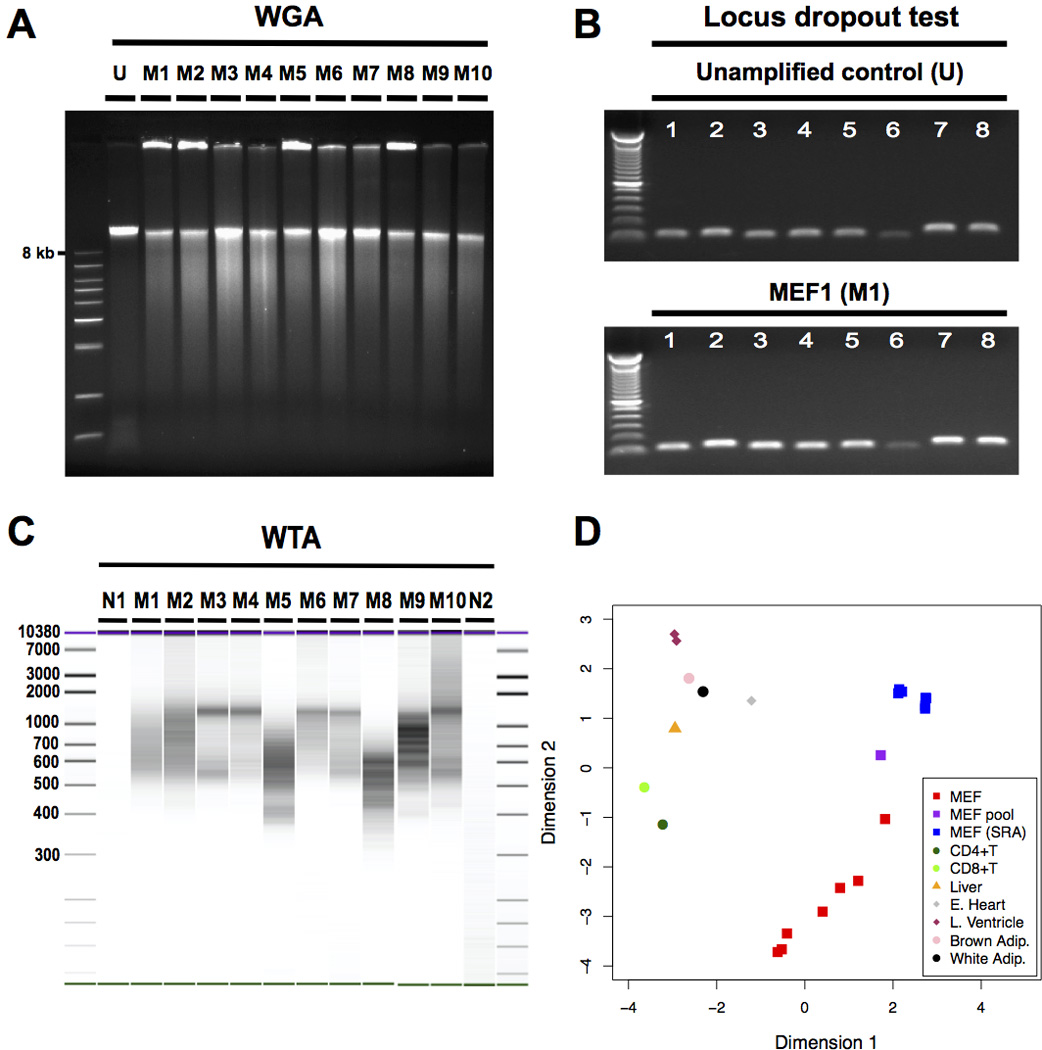
(A) Agarose electrophoresis indicated the high-molecular weight amplification product expected after successful whole genome amplification (WGA). (B) An example of a locus dropout test (LDO) covering 8 loci on 4 chromosomes indicating successful, relatively unbiased WGA. Numbers 1 to 8 indicate the LDO primer pairs. (C) BioAnalyzer (BA) image indicated successful whole transcriptome amplification (WTA). Samples N1 to M8 were run on one BA High Sensitivity DNA chip, with samples M9 to N2 on another. The two BA runs underwent identical image processing and were combined into one image. (D) Multi-dimensional scaling (MDS) plot confirmed MEF-specificity of single cell WTA amplicons. The MDS plot illustrates that when clustering the top 500 most variable genes between the MEF bulk and a number of publicly available RNA-seq data sets from MEFs and other cells and tissues, single amplified MEFs tended to cluster together with MEF cell populations but not with other types of cells/tissues. Abbreviation: Adip: adipose tissue; CD4+T: CD4+ T cell; CD8+T: CD8+ T cell; E. Heart: embryonic heart; L. Ventricle: left ventricle; M1 to M10: MEF1 to MEF10; MEF: single amplified MEF of the current study; MEF pool: unamplified MEF bulk of the current study; MEF (sra): RNA-seq data of MEF bulk downloaded from sequence read archive; N1: negative control 1 (no reverse transcriptase); N2: negative control 2 (no cell); U: Unamplified control.