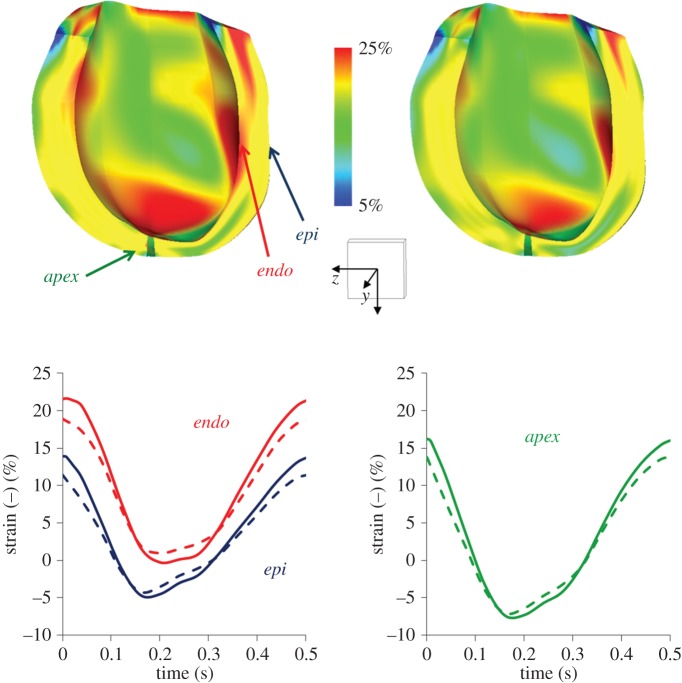
Figure 9.
Strain pattern in the fibre direction for the stage 1 and stage 2 obtained from the multiscale model. The colour map (upper panels) shows the fibre strain at end-diastole. The time profile of the myocardial strains (lower panels) at different locations (points at epicardial (epi) and endocardium (endo) middle cross section and at the apex (apex)) are shown. The solid lines indicate the stage 1 results, whereas the dashed lines refer to stage 2 results. A scale cube (1 cm3) and the Cartesian coordinate system are shown. (Online version in colour.)

