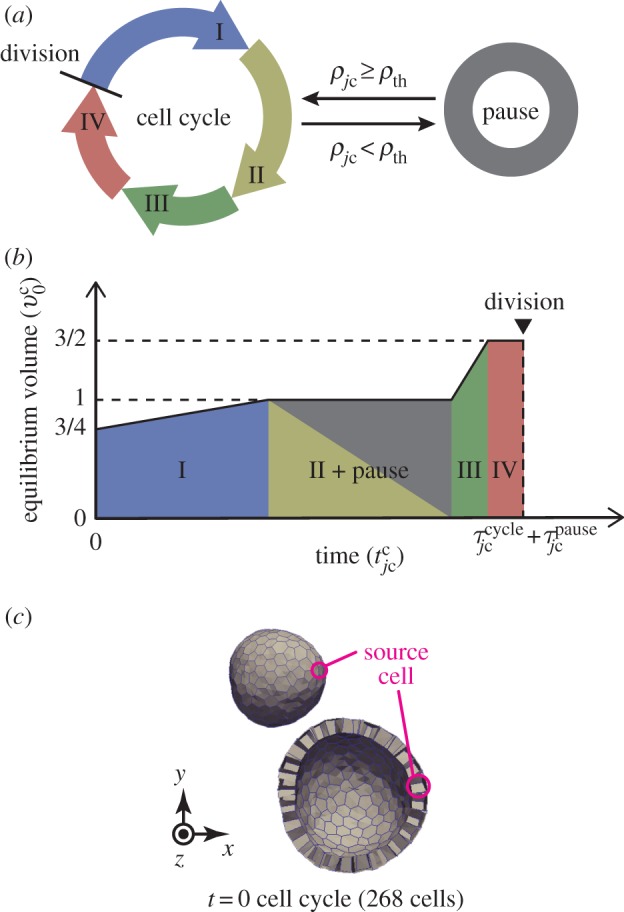
Figure 2.

Cell growth behaviour and initial structure. (a) Illustration of the cell cycle. A divided cell grows from state I to IV successively. The cell growth pauses when its molecular density is less than the threshold ρth. (b) Increase in cell volume according to cell states. (c) Whole and clip views of an epithelial vesicle under initial conditions. The monolayer tissue involves a single source cell that produces growth molecules. In (c), the clip view of tissues is shown 1.5 times as large as the whole view. (Online version in colour.)
